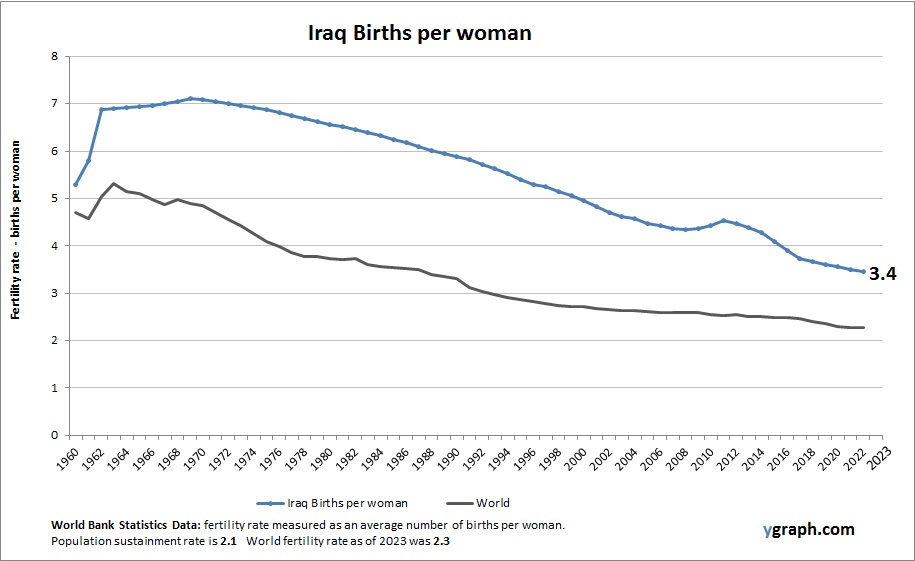
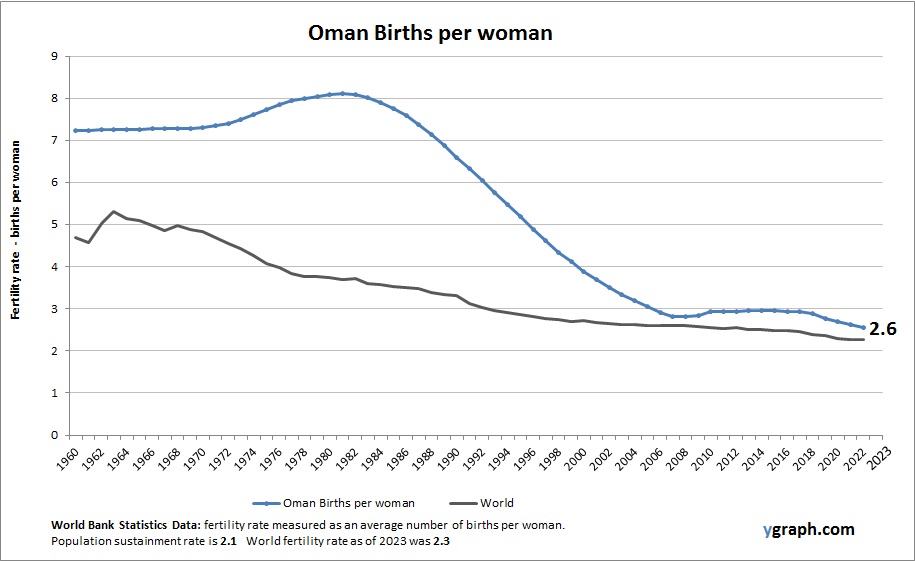
Netherlands Births per woman

Chart above demonstrates Netherlands Births per woman. This is according to World Bank birth stats by country. Based on the latest demographics info provided for Netherlands.

The Netherlands experiences low fertility rates, typical of Western European countries, influenced by factors such as delayed childbearing, high female labor participation, and widespread access to contraception. Although birth rates hover below replacement level, immigration helps sustain population size. Policies supporting work-life balance and family welfare contribute to demographic stability.

Netherlands Births per woman

Portugal Population

The above graph shows Portugal Population. World Bank is the source of this population data. Based on the latest available information for Portugal.

Portugal’s population is stable or slowly declining due to low fertility rates and emigration. Urban centers such as Lisbon and Porto attract residents, while rural areas face depopulation and aging demographics. Government initiatives seek to encourage family growth and immigration to support demographic balance.

Portugal Population

Latvia Births per woman

Chart above demonstrates Latvia Births per woman. World Bank is the source of this birth data. Latest births per woman information for Latvia.

Latvia’s fertility rate remains low, consistent with many Eastern European countries. Economic uncertainty, migration, and changing social norms have led to delayed childbearing and smaller families, contributing to population decline and aging.

Latvia Births per woman

St. Kitts and Nevis Births per woman

Chart above demonstrates St. Kitts and Nevis Births per woman. The fertility rate statistics are compiled by World Bank. Based on the latest demographics info provided for St. Kitts and Nevis.

St. Kitts and Nevis has moderate fertility rates, reflecting trends common in small Caribbean nations where urbanization, education, and access to healthcare have gradually reduced family sizes. While birth rates have declined compared to previous decades, cultural values and economic factors still influence demographic patterns. The population growth remains modest, supported by relatively stable social and economic conditions.

St. Kitts and Nevis Births per woman

Czechia Population

This diagram presents Czechia Population. World Bank is the source of this population data. Latest population information for Czechia.

Czechia has a stable population with low fertility rates below replacement level. Urbanization is high, and many families delay childbirth due to economic and career considerations. Government policies have attempted to support family growth, but demographic aging remains a key issue.

Czechia Population

Antigua and Barbuda Births per woman

The above graph shows Antigua and Barbuda Births per woman. World Bank is the source of this birth data. Based on the latest available information for Antigua and Barbuda.

Antigua and Barbuda have low to moderate fertility rates influenced by urban lifestyles, access to healthcare, and economic factors. Population growth is slow, with migration and tourism shaping demographic trends. The country faces challenges related to youth employment and social services.

Antigua and Barbuda Births per woman

Sub Saharan Africa Births per woman

Chart above demonstrates Sub Saharan Africa Births per woman. The fertility rate statistics are compiled by World Bank. Based on the latest available information for Sub Saharan Africa.

Sub-Saharan Africa is characterized by some of the highest fertility rates in the world, with women typically having multiple children due to cultural norms, limited access to family planning, and economic factors. Despite gradual declines in fertility in some countries, population growth remains rapid, driven by a youthful demographic and high birth rates. This rapid growth presents both opportunities and challenges for development, particularly in education, healthcare, and infrastructure.

Sub Saharan Africa Births per woman

Syria Births per woman

This diagram presents Syria Births per woman. This is according to World Bank birth stats by country. Based on the latest available information for Syria.

Syria’s fertility rates were traditionally high but have declined due to prolonged conflict, displacement, and socioeconomic disruption. The ongoing crisis has deeply affected demographic patterns, with shifts in birth rates and population distribution.

Syria Births per woman

Denmark Births per woman

Chart above demonstrates Denmark Births per woman. This is according to World Bank birth stats by country. Latest births per woman information for Denmark.

Denmark maintains low fertility rates consistent with Nordic countries but benefits from extensive family-friendly policies such as generous parental leave and affordable childcare. These measures support birth rates near replacement level despite broader European trends of decline.

Denmark Births per woman

Upper middle income Population

The above graph shows Upper middle income Population. This is according to World Bank total population stats. Latest population information for Upper middle income.

The population of upper middle income countries is characterized by moderate growth rates and ongoing demographic transitions. These countries are typically experiencing declines in fertility rates as urbanization and economic development progress, leading to aging populations in some regions. Health improvements and increased educational attainment contribute to longer life expectancy, while migration patterns vary widely depending on economic opportunities and political stability. The balance between youthful and aging populations presents both opportunities and challenges for sustainable development.

Upper middle income Population