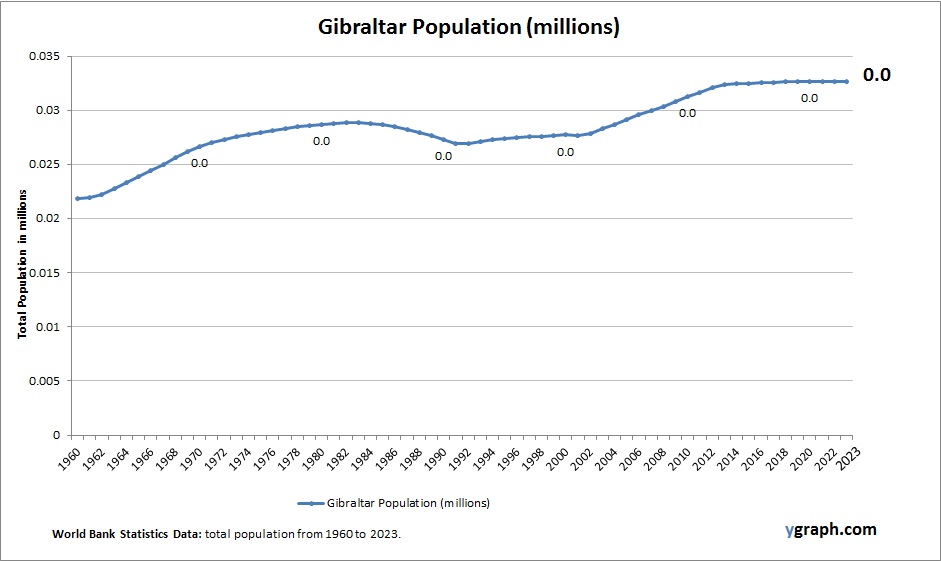
East Asia & Pacific Population

The above graph shows East Asia & Pacific Population. This is according to World Bank total population stats. Based on the latest available information for East Asia & Pacific.

The East Asia & Pacific region features a large and diverse population with varying growth rates. While countries like China and Japan face aging and low fertility, others such as the Philippines and Indonesia maintain youthful, growing populations.

East Asia & Pacific Population

Faroe Islands Population

The above graph shows Faroe Islands Population. The country statistics are compiled by World Bank. Based on the latest demographics info provided for Faroe Islands.

The Faroe Islands have a small and stable population with relatively high living standards. Fertility rates are moderate for Europe, and migration trends significantly influence population size and structure due to the islands’ remote geography.

Faroe Islands Population

Mexico Population

The above graph shows Mexico Population. World Bank is the source of this population data. Latest population information for Mexico.

Mexico’s population is large and urbanizing rapidly, with declining fertility rates compared to previous decades. Economic development, education, and healthcare improvements contribute to slower population growth and demographic shifts towards an aging population.

Mexico Population

Chile Births per woman

The above graph shows Chile Births per woman. World Bank is the source of this birth data. Based on the latest demographics info provided for Chile.

Chile has seen a steady decline in fertility rates, now near or below replacement level. Economic development, urbanization, and expanded access to education and healthcare have contributed to smaller family sizes across the country.

Chile Births per woman

United Kingdom Population

The above graph shows United Kingdom Population. World Bank is the source of this population data. Based on the latest demographics info provided for United Kingdom.

The UK has a large and slowly growing population, shaped by immigration and declining birth rates. Urban centers continue to expand, while an aging population and regional demographic shifts pose long-term policy considerations.

United Kingdom Population

Congo Democratic Republic Births per woman

The above graph shows Congo Democratic Republic Births per woman. World Bank is the source of this birth data. Based on the latest available information for Congo Democratic Republic.

The Democratic Republic of the Congo has one of the highest fertility rates in the world, with women averaging more than six children. This high rate reflects limited access to contraception, early marriage, and cultural norms favoring large families. The rapid population growth presents challenges for education, health services, and economic development.

Congo Democratic Republic Births per woman

Uruguay Births per woman

Chart above demonstrates Uruguay Births per woman. World Bank is the source of this birth data. Based on the latest demographics info provided for Uruguay.

Uruguay is characterized by low fertility rates reflecting high levels of urbanization, education, and healthcare quality. The population is aging, with life expectancy among the highest in Latin America. Social and economic stability has contributed to demographic transitions toward smaller family sizes and slower population growth.

Uruguay Births per woman

Singapore Population

This diagram presents Singapore Population. This is according to World Bank total population stats. Based on the latest demographics info provided for Singapore.

Singapore’s population is characterized by low fertility rates and a highly urbanized environment. Despite government initiatives to boost birth rates, economic pressures and lifestyle choices keep fertility below replacement. Immigration and a strong economy maintain population growth, while social policies adapt to challenges related to an aging population.

Singapore Population

Costa Rica Births per woman

This diagram presents Costa Rica Births per woman. This is according to World Bank birth stats by country. Latest births per woman information for Costa Rica.

Costa Rica has moderate fertility rates that have been declining due to improved education and healthcare. Population growth is slowing, with urbanization and economic development influencing family size decisions. The country benefits from a youthful demographic relative to some developed nations.

Costa Rica Births per woman

Honduras Births per woman

This diagram presents Honduras Births per woman. This is according to World Bank birth stats by country. Based on the latest available information for Honduras.

Honduras maintains moderately high fertility rates compared to global averages, driven by cultural norms and rural population distribution. Urbanization and educational improvements are gradually contributing to fertility declines. Population growth remains steady, influencing demands on infrastructure and social services.

Honduras Births per woman