Due to bullwhip effect the orders to upstream members of the supply chain (producers of raw goods) see greater variance than actual orders demanded by consumers. The variance grows with each additional member of the supply chain. http://freelancerconsulting.com https://ygraph.com/chart/546
Category Archives: Business
The Bullwhip Effect is a deformation in
The Bullwhip Effect is a deformation in information when it goes upstream in the supply chain. More precisely, the demand of the customer is put out of shape each time it goes from a company to another. Source: http://www.damas.ift.ulaval.ca/~moyaux/travailE.html https://ygraph.com/chart/547
The Bullwhip Effect is a deformation in
Porter’s Value Chain Analysis: Internal
Porter’s Value Chain Analysis: Internal analysis. Porter Value Chain Chart. Porter’s Framework. Porter’s Diagram. Porter’s Strategy Value chain analysis. Internal analysis. Business analysis. Source: Porter’s Value Chain Analysis – Porter’s Value Chain
Porter’s Value Chain Analysis: Internal
Bussiness Level Strategy: Product Differ
Bussiness Level Strategy: Product Differentiation, Cost Leadership, Focus Differentiation, Cost Differentiation, Cost Focus. Source: http://freelancerconsulting.com/business-frameworks/positioning-strategy-scope-cost-differentiation-focus.html https://ygraph.com/chart/433
Bussiness Level Strategy: Product Differ
Bases of Competitive Advantage. Source:
Bases of Competitive Advantage. Source: http://freelancerconsulting.com/business-frameworks/positioning-strategy-scope-cost-differentiation-focus.html https://ygraph.com/chart/437
Bases of Competitive Advantage. Source:
The Technology Adoption Cycle. Innovator
The Technology Adoption Cycle. Innovators, Early Adopters, Early Majority, Late Majority, Laggards. Source: http://freelancerconsulting.com/business-frameworks/technology-adoption-product-life-cycle.html https://ygraph.com/chart/441
The Technology Adoption Cycle. Innovator
Landscape of the Technology Adoption Lif
Landscape of the Technology Adoption Life-Cycle: The Chasm, The tornado, The bowling valley, Main Street, End of Life. Source: http://freelancerconsulting.com/business-frameworks/technology-adoption-product-life-cycle.html https://ygraph.com/chart/440
Landscape of the Technology Adoption Lif
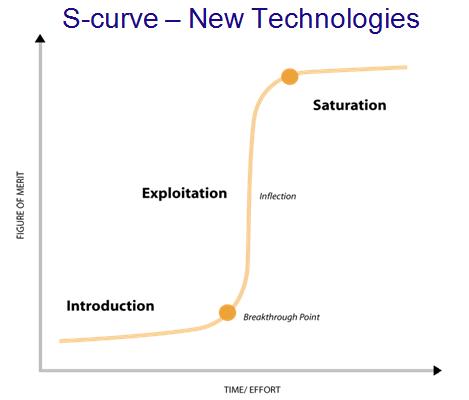
Business S-curve, New Technologies. Sou
Business S-curve, New Technologies. Source: The Technology Adoptation Cycle. Innovators, Early Adopters, Early Majority, Late Majority, Laggards. Technology Adoption curve showing different stages of technology development, maturity and use. business s-curve
Business S-curve, New Technologies. Sou
IT Framework. IT strategy framework con
IT Framework. IT strategy framework consistent with coordination, collaboration, risk coverage and management across the enterprise. Most organizations do not spend enough time defining critical business drivers. Source: http://www.ism-journal.com/ITToday/ITRM.htm https://ygraph.com/chart/691
IT Framework. IT strategy framework con
Porter’s Value Chain Analysis: Internal
Porter’s Value Chain Analysis: Internal analysis. Porter Value Chain Chart. Porter’s Framework. Porter’s Diagram. Porter’s Strategy Value chain analysis. Internal analysis. Business analysis. Source: Porter’s Value Chain Analysis – Porter’s Value Chain