Smart Goals – S.M.A.R.T. goals – SMART Goals Framework – Smart, Measurable, Assignable, Realistic, Time-Based Goals – s.m.a.r.t. goals model. What are smart goals? Source: PennState https://ygraph.com/chart/2093
Category Archives: Business
Project Management – Project Management
Project Management – Project Management Approach – Project Management Steps – Project Management Phases – Phased Approach – Project Management Cycle: Iniatiation, Planning and Design, Executing, Monitoring and Controlling, Closing. PMP, PMI, PMO. Source: Wikipedia https://ygraph.com/chart/2091
Project Management – Project Management
Project Management Diagram – Project Man
Project Management Diagram – Project Management Chart – Quality, Time, Cost, Scope are the 4 fundamental parts of any project. Project Manager (PM) must balance time, cost and scope to provide quality required by stakeholders and project sponsors. Source: Mezzmedia https://ygraph.com/chart/2092
Project Management Diagram – Project Man
DMAIC – Lean Six Sigma DMAIC process met
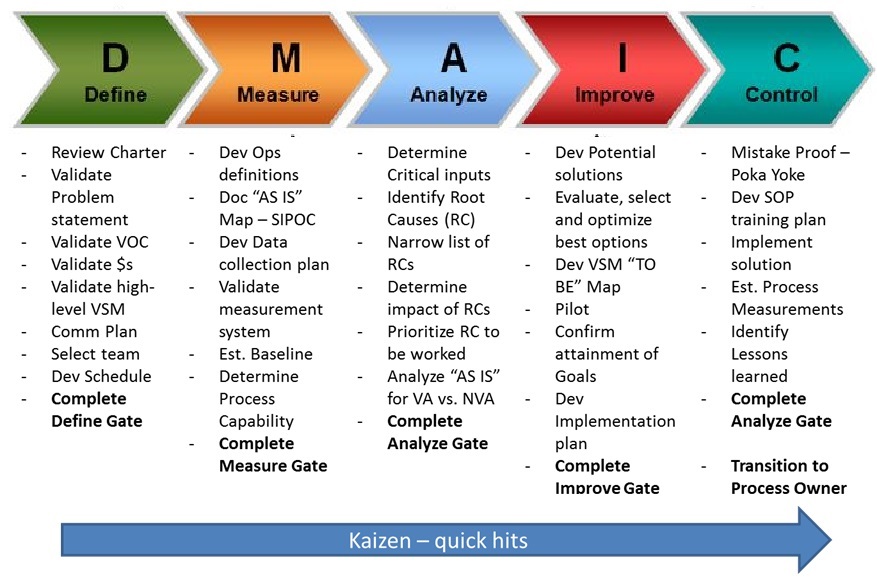
DMAIC – Lean Six Sigma DMAIC process methodology defines a framework on how to approach process improvement. DMAIC stands for Define, Measure, Analyze, Improve and Control phases. Data collection and analysis is at the core of this method. This serves as a roadmap for analyzing business processes in an organization. Source: Lean Six Sigma Diagrams dmaic process
DMAIC – Lean Six Sigma DMAIC process met
Porter Five Forces model, external indus
Porter Five Forces model, external industry analysis. Source: http://freelancerconsulting.com https://ygraph.com/chart/428
Porter Five Forces model, external indus
Business evolutionary model. Technology
Business evolutionary model. Technology paradigms shifts. Paradigm Shift. Evolutionary business model explains how business develops and adopts through technological change and time through paradigm shiftsbusiness evolutionary model
Business evolutionary model. Technology
Top Consulting Firms. Consulting compan
Top Consulting Firms. Consulting companies market share and industry structure. Gartner’s study on the market share of the leading consulting firms globally 2008 – 2009. Changes in 2010 – 2011? Source: http://neurojava.net/2010/05/06/consulting-landscape/ https://ygraph.com/chart/622
Top Consulting Firms. Consulting compan
Mortgage Rate Graph 2011. Mortgage rates
Mortgage Rate Graph 2011. Mortgage rates have increased after Fed’s 2nd round of quantitative easing in 2010 (QE II). 30 year mortgage rate changes graph. Source: http://www.northerntrust.com/ https://ygraph.com/chart/624
Mortgage Rate Graph 2011. Mortgage rates
Mortgage Rate Chart 1972 – 2011. 30-Yea
Mortgage Rate Chart 1972 – 2011. 30-Year Fixed Mortgage Rates National Yearly Averages. Mortgage Rate Graph. Source: http://dc.urbanturf.com/articles/blog/a_quick_history_of_mortgage_rates/2741 https://ygraph.com/chart/626
Mortgage Rate Chart 1972 – 2011. 30-Yea
Offshore Company Structure and Chart. O
Offshore Company Structure and Chart. Offshore trust owns an offshore holding company, which owns offshore trading company and offshore investment company, with an offshore bank account, protection of owner. Source: http://www.setuphkcompany.com/blog/archives/23 https://ygraph.com/chart/647