Venn diagrams are a type of diagram that shows the logical relationship between sets. They were popularized by John Venn in the 1880s and are used to teach elementary set theory, as well as illustrate simple set relationships in probability, logic, statistics, linguistics, and computer science .
A Venn diagram uses simple closed curves drawn on a plane to represent sets. These curves are often circles or ellipses. The points inside a curve labeled S represent elements of the set S, while points outside the boundary represent elements not in the set S. A Venn diagram consists of multiple overlapping closed curves, usually circles, each representing a set. The points inside a curve labeled S represent elements of the set S, while points outside the boundary represent elements not in the set S .
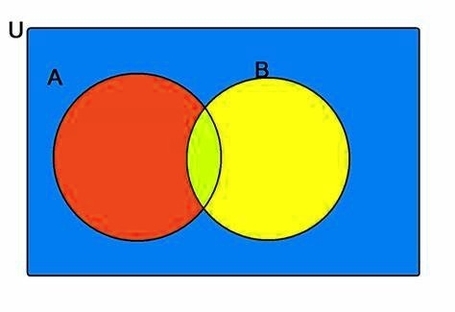
Venn diagrams are used to illustrate the relationships between sets. For example, if we have two sets, A and B, we can use a Venn diagram to show the relationship between them. The area where the two circles overlap represents the elements that are in both sets. The area outside the circles represents the elements that are not in either set. The area inside each circle represents the elements that are only in that set .
Venn diagrams can also be used to illustrate more complex relationships between sets. For example, if we have three sets, A, B, and C, we can use a Venn diagram to show the relationship between them. The area where all three circles overlap represents the elements that are in all three sets. The area where two circles overlap represents the elements that are in both of those sets, but not in the third set. The area where only one circle is present represents the elements that are only in that set .
Venn diagrams are a useful tool for visualizing set relationships and can be used to solve problems in a variety of fields. For example, they can be used to solve problems in probability theory, logic, statistics, linguistics, and computer science. They are also used in business and marketing to analyze customer data and identify patterns .
In summary,