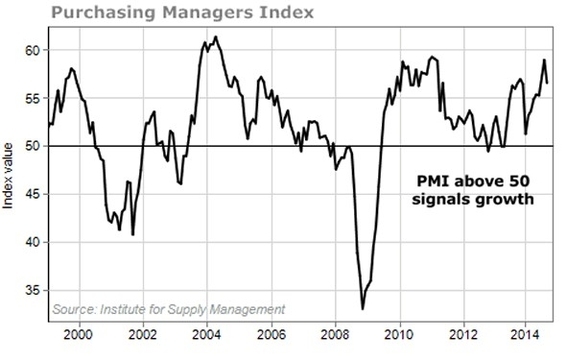
The United States economy is the largest in the world by nominal GDP and the second-largest by purchasing power parity (PPP) behind China . In 2022, the U.S. had the world’s seventh-highest per capita GDP (nominal) and the eighth-highest per capita GDP (PPP) . The U.S. economy is a highly developed mixed economy .
According to the Bureau of Economic Analysis, the U.S. economy grew at an annual rate of 4.9 percent in the third quarter of 2023 . The increase in the third quarter primarily reflected increases in consumer spending and inventory investment . In the second quarter, real GDP increased 2.1 percent . The U.S. economy has been growing at a steady pace since 2021, rebounding from a sharp but brief coronavirus-induced recession in March 2020 .
Consumer spending comprised 68% of the U.S. economy in 2022, while its labor share of income was 44% in 2021 . The U.S. has the world’s largest consumer market .
The U.S. Bureau of Labor Statistics reports that the unemployment rate in December 2023 was 3.9% . The U.S. has a highly diversified economy with a wide range of industries, including healthcare, technology, finance, and manufacturing .
The U.S. economy is also the world’s largest recipient of foreign direct investment . The U.S. is home to many of the world’s largest corporations, including Apple, Amazon, and Microsoft .
In conclusion, the U.S. economy is a highly developed mixed economy with a wide range of industries and the world’s largest consumer market . The U.S. economy has been growing at a steady pace since 2021, rebounding from a sharp but brief coronavirus-induced recession in March 2020 . The unemployment rate in December 2023 was 3.9% .
