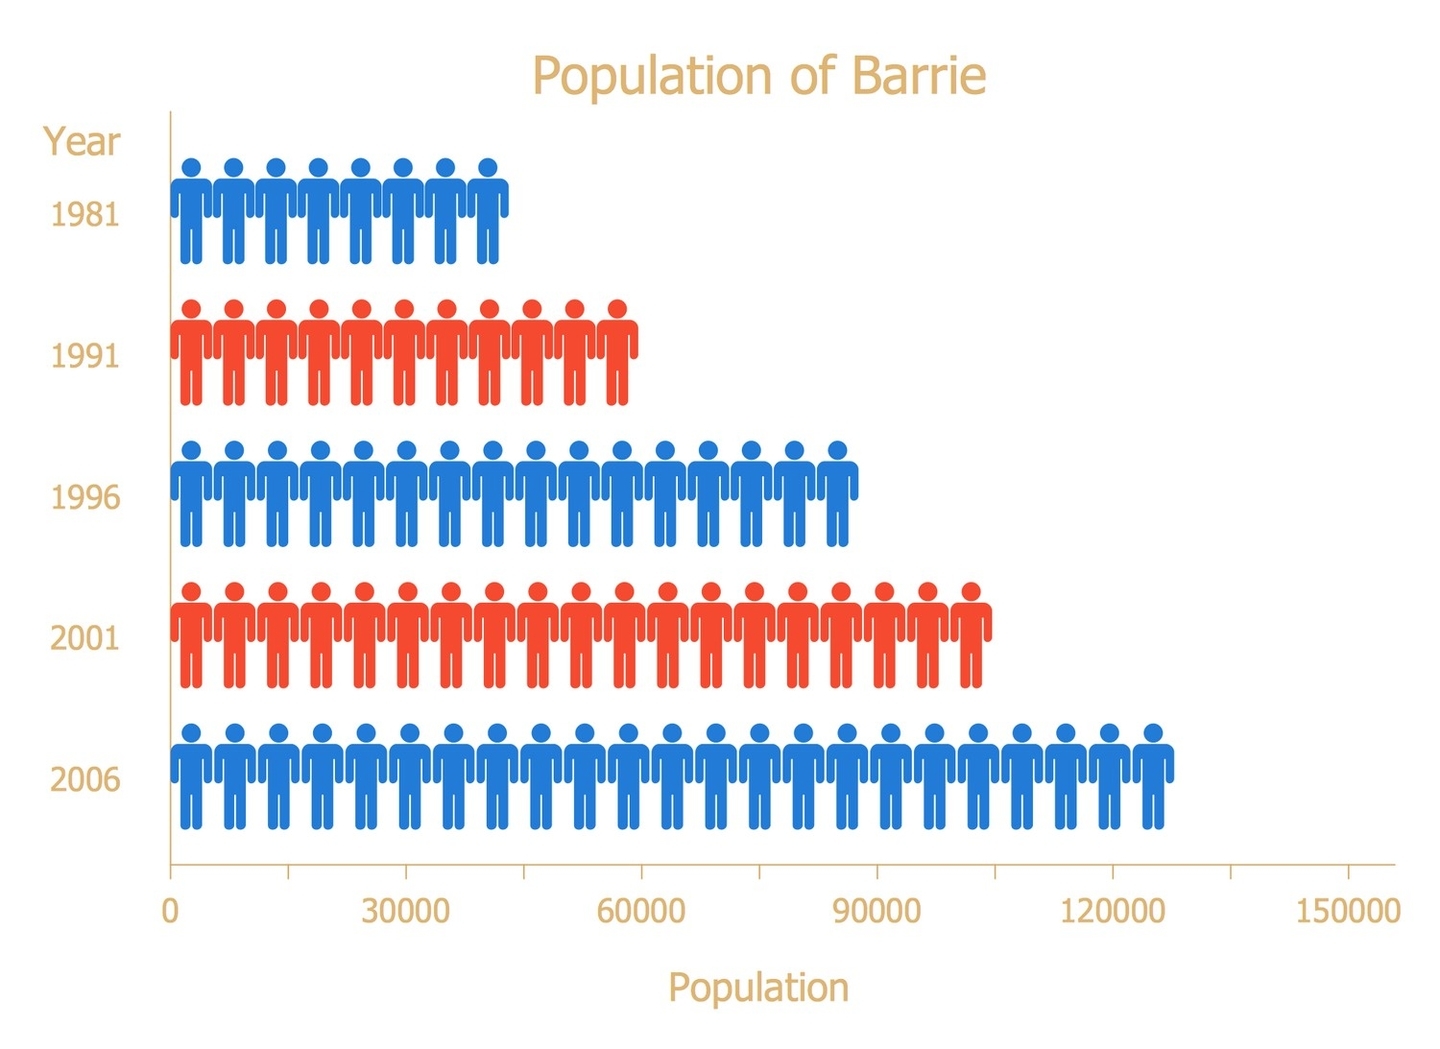
Population graphs are visual tools that display demographic data such as age distribution, fertility rates, and growth trends. Common types include population pyramids, line graphs showing population changes over time, and bar charts comparing regional demographics, all of which help analyze and interpret population dynamics effectively.
