Stock Market Growth Chart

Stock market growth is the increase in the value of stocks over time. Stocks are shares of ownership in a company that can be bought and sold on a stock exchange. Stock market growth can be measured by various indicators, such as the Dow Jones Industrial Average (DJIA), the S&P 500, or the Nasdaq Composite. These are indexes that track the performance of a group of stocks from different sectors and industries.
tock market growth depends on many factors, such as the economic conditions, corporate earnings, investor sentiment, interest rates, inflation, geopolitical events, and technological innovations. Stock market growth can benefit investors who hold stocks for a long period of time, as they can enjoy capital appreciation and dividends. However, stock market growth also involves risks, such as volatility, market crashes, bubbles, and fraud.
tock market growth can be classified into two types: value and growth. Value stocks are those that are undervalued by the market, meaning that their current price is lower than their intrinsic value. Value investors look for stocks that have strong fundamentals, such as earnings, assets, cash flow, and dividends, but are trading at a discount. Value stocks tend to have lower price-to-earnings (P/E) ratios and higher dividend yields than the market average.

Growth stocks are those that have high potential for future growth, meaning that their current earnings and revenues are expected to increase significantly in the future. Growth investors look for stocks that have innovative products, services, or business models, and are dominating their markets or creating new ones. Growth stocks tend to have higher P/E ratios and lower dividend yields than the market average.

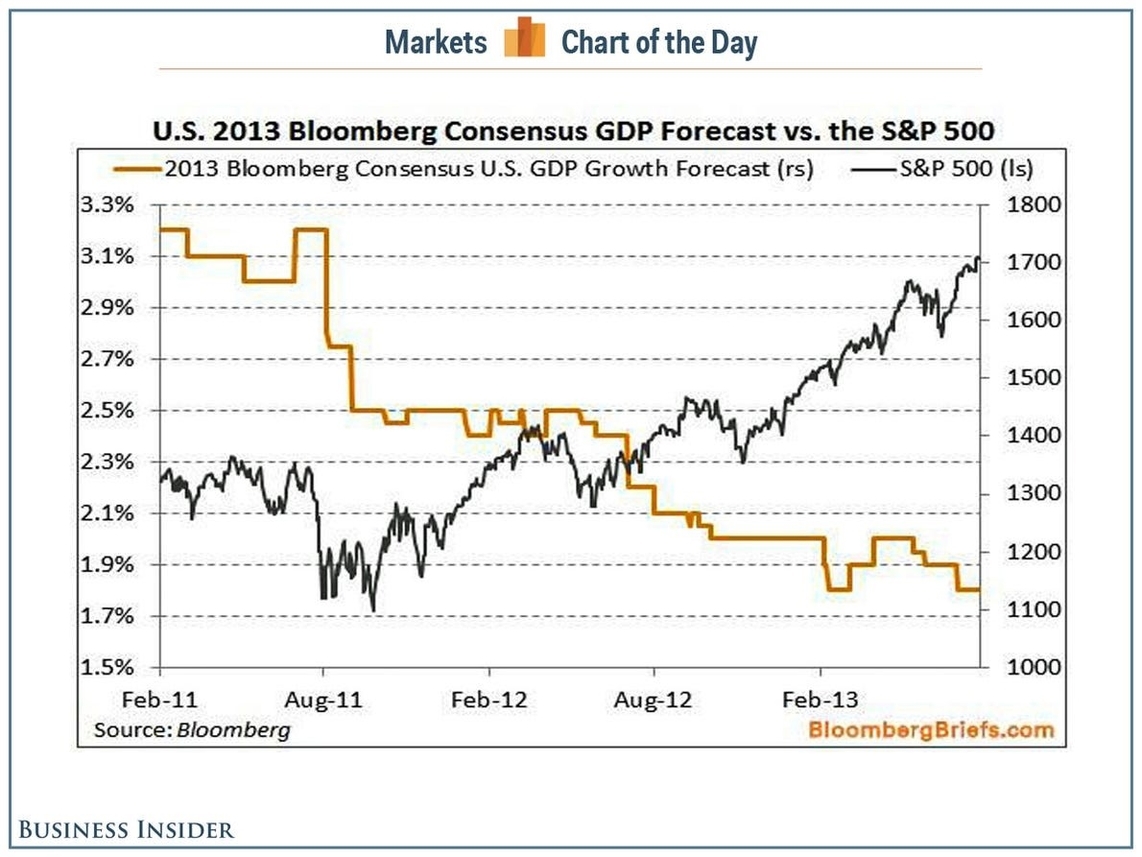
The performance of value and growth stocks can vary depending on the market cycle. Generally, value stocks tend to outperform growth stocks during recessions, when investors seek safety and stability, and growth stocks tend to outperform value stocks during expansions, when investors seek higher returns and growth opportunities. However, there are exceptions and anomalies to this pattern, as some stocks can exhibit both value and growth characteristics, or switch between them over time.

The average stock market return over the past 10 years, as measured by the S&P 500, was about 12.39% annually. This means that if an investor invested $100 in the S&P 500 at the beginning of 2014, they would have $339.92 at the end of 2023, assuming they reinvested all dividends. However, this does not account for inflation, taxes, fees, or individual stock performance, which can affect the actual return of an investor.

The following is a table that shows the annual
Stock Market Growth Chart

Life History Diagram 9

Life History 9 is a term that does not have a clear definition. It is possible that you are referring to a specific event, person, or concept. Could you please provide more context or details about what you are looking for? I will do my best to provide you with the information you need. ??

Life History Diagram 9

China’s Economic Growth

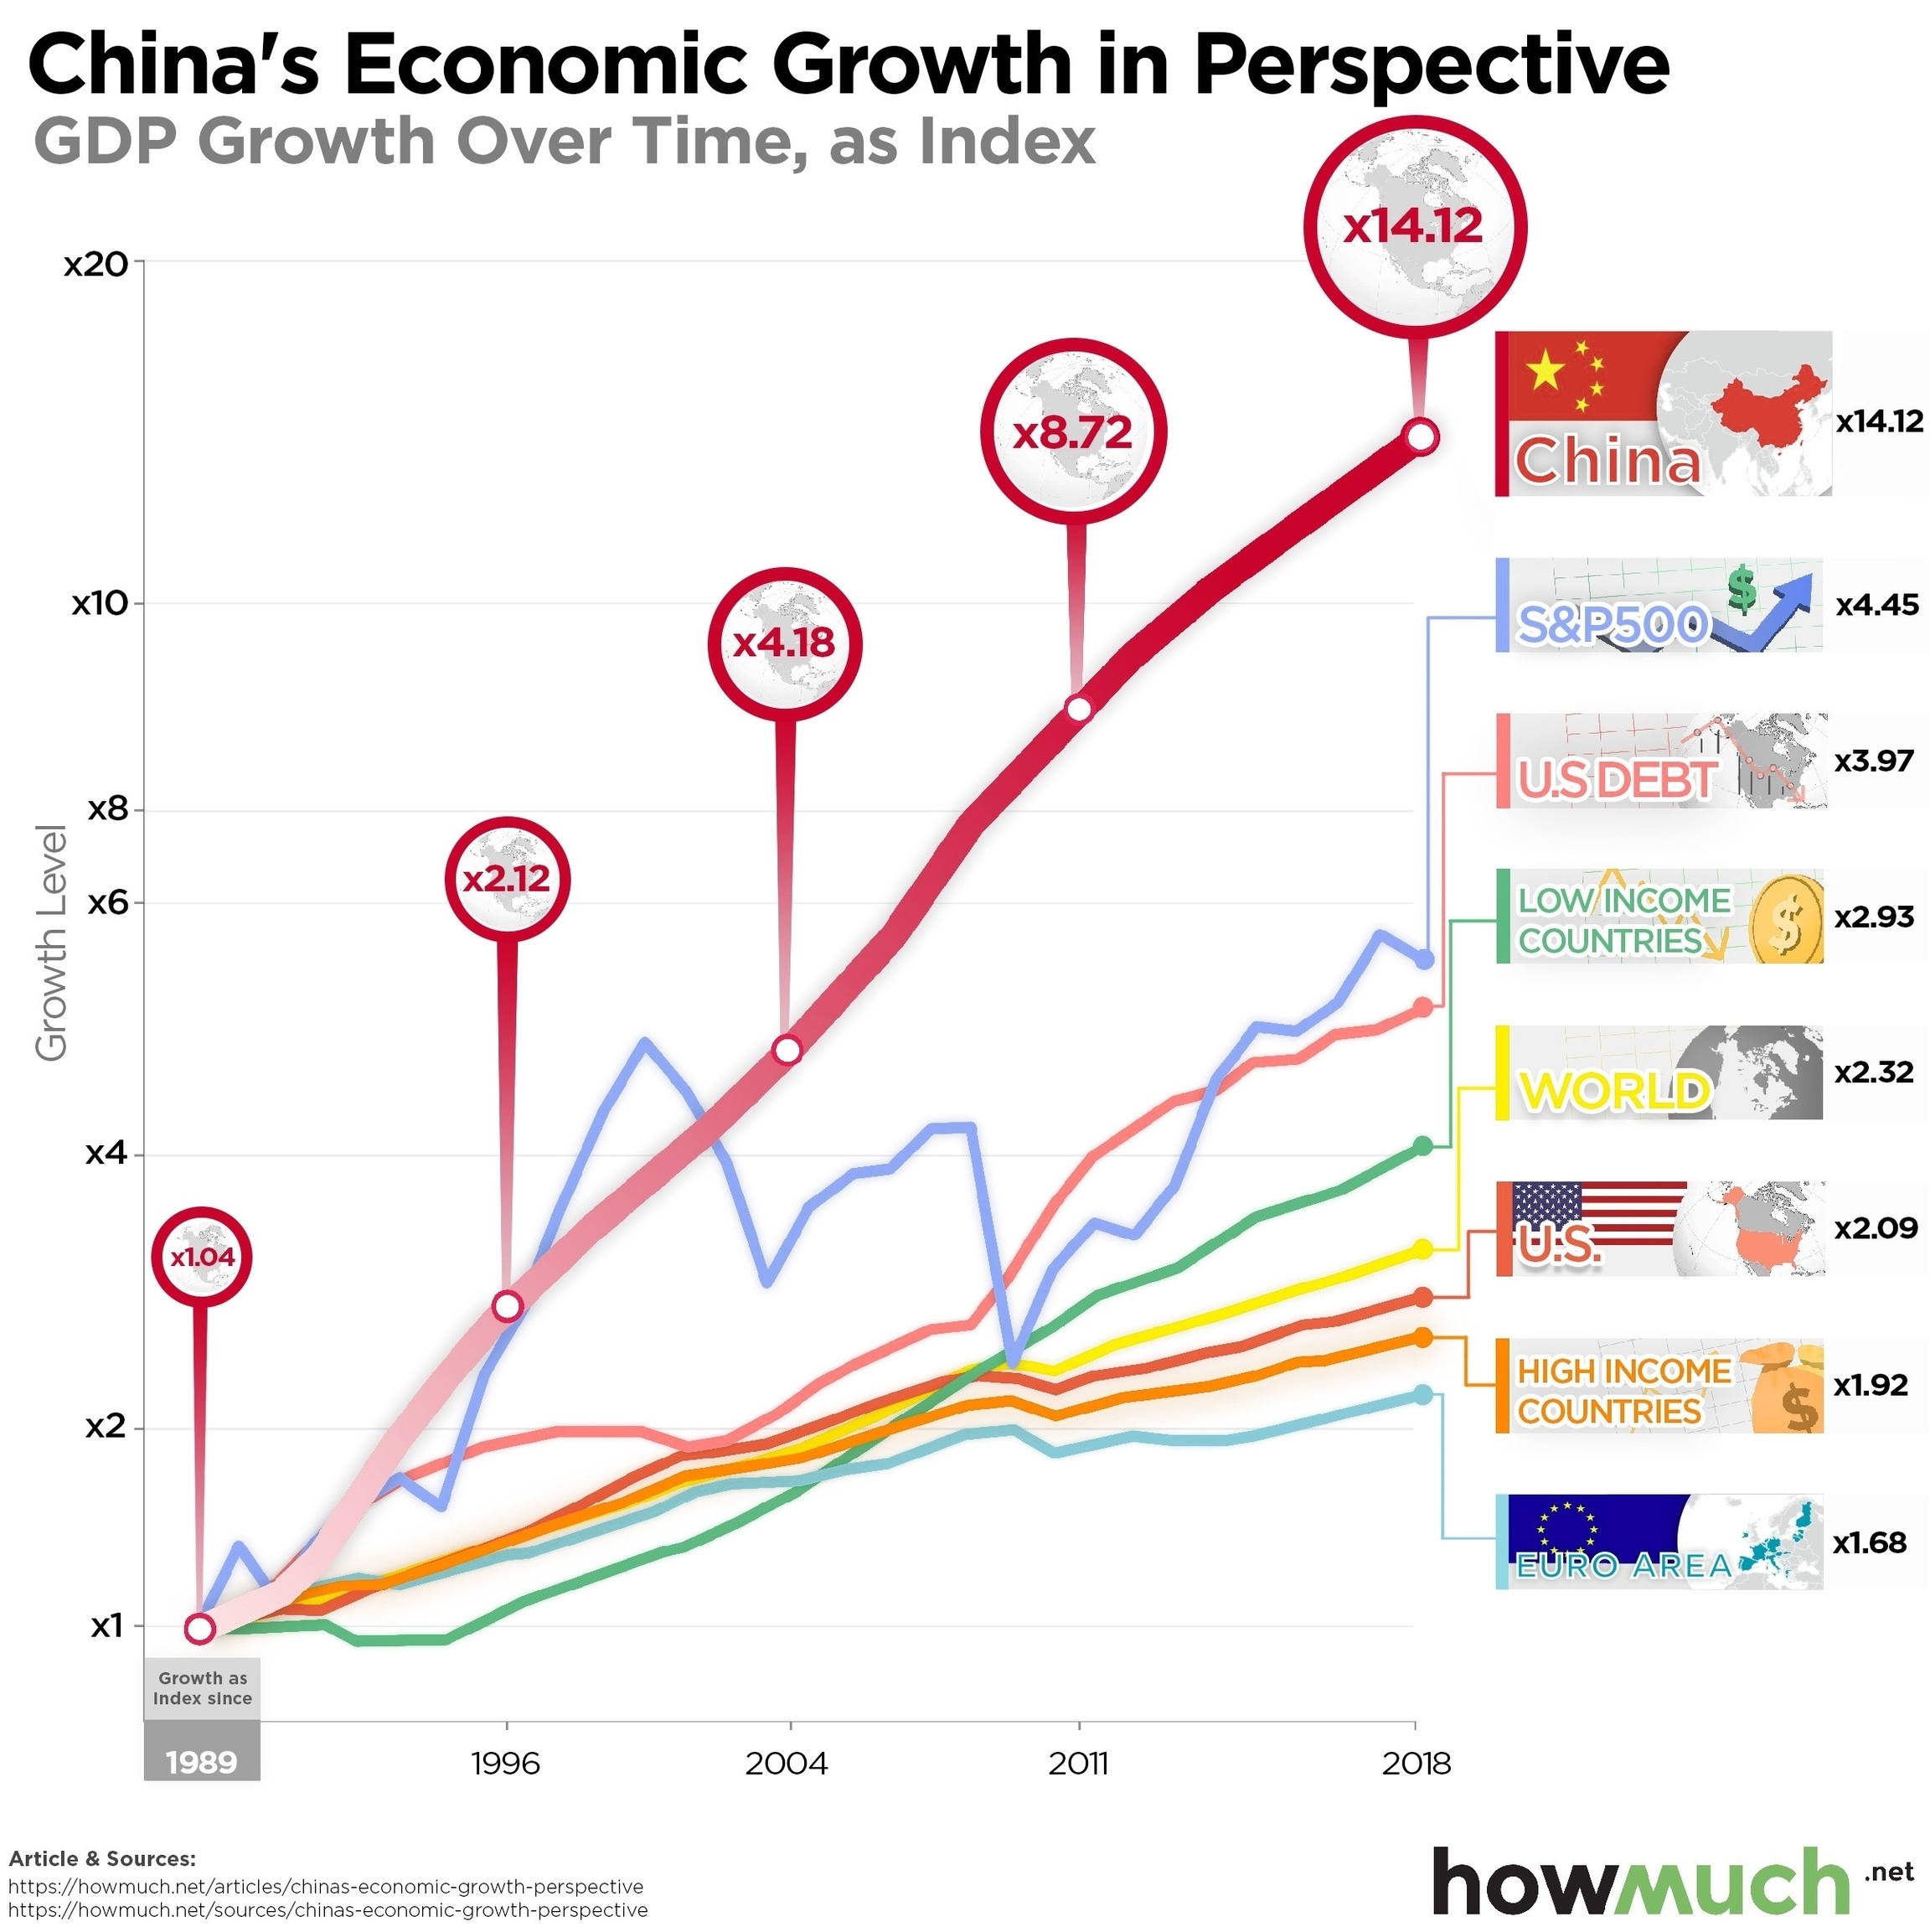
China’s economy has been growing at a rapid pace over the past few decades, making it one of the world’s largest economies. According to the World Bank, China’s GDP has grown at an average rate of 9.6% per year from 1979 to 2019. In 2020, China was the only major economy to experience GDP growth, with a 2.3% increase . The country’s GDP growth rate for 2021 was 21.33%, which is a significant increase from the previous year . The International Monetary Fund (IMF) has raised its forecast for China’s economic growth in 2022 to 5.4% .

China’s sustained growth can be attributed to its export relations, manufacturing sector, and low-wage workers . However, the country’s economic performance has been affected by the COVID-19 pandemic, with one of its worst economic performances in decades in 2022 . The government has set a modest GDP target of around 5% for 2023 .

In terms of GDP, China’s economy is the second-largest in the world, with a GDP of $17,963.17 billion in 2022 . The country’s manufacturing sector is one of the largest in the world, with a significant contribution to the country’s GDP .

In conclusion, China’s economic growth has been remarkable over the past few decades, with the country’s GDP growing at an average rate of 9.6% per year from 1979 to 2019. The country’s sustained growth can be attributed to its export relations, manufacturing sector, and low-wage workers. However, the COVID-19 pandemic has had a significant impact on the country’s economic performance, with one of its worst economic performances in decades in 2022. The government has set a modest GDP target of around 5% for 2023.

China's Economic Growth

World Population Growth Rate Chart

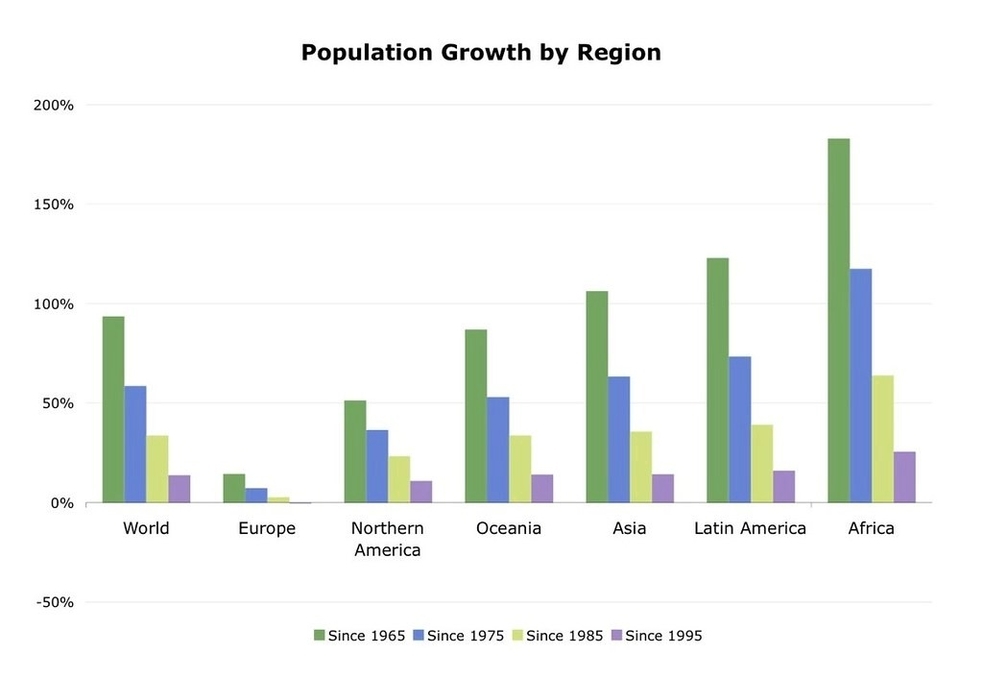
World population growth rate is the measure of how fast the number of people in the world is increasing. It is usually expressed as a percentage or a ratio of births and deaths per year.

According to the [World Population Clock](^2^), the world population is growing at a rate of around 0.91% per year in 2024, which means that there are about 74 million more people each year. This is lower than the peak growth rate of 2.3% per year in 1963, and it is expected to decline further in the future.

The main factors that affect the world population growth rate are fertility, mortality, and migration. Fertility is the average number of children that a woman has in her lifetime. Mortality is the number of deaths per year. Migration is the movement of people from one country or region to another.

Fertility rates have been declining globally due to various reasons, such as improved education, health care, family planning, and women’s empowerment. The global average fertility rate was 2.4 children per woman in 2020, down from 4.9 in 1950. However, there are still large differences between regions and countries, with some having very high fertility rates (such as Niger with 6.9) and some having very low ones (such as South Korea with 1.1).

Mortality rates have also been declining globally due to advances in medicine, sanitation, nutrition, and public health. The global average life expectancy at birth was 72.6 years in 2020, up from 46.5 in 1950. However, there are still large gaps between regions and countries, with some having very high mortality rates (such as Sierra Leone with 18.4 deaths per 1,000 people) and some having very low ones (such as Japan with 3.3).

Migration is a complex phenomenon that involves various economic, social, political, and environmental factors. Some people migrate voluntarily for better opportunities, education, or quality of life, while others are forced to migrate due to conflict, violence, persecution, or natural disasters. Migration can affect the population growth rate of both the origin and destination countries, depending on the number, age, and gender of the migrants.

The United Nations Population Division (UNPD) produces projections of the future world population based on different assumptions about fertility, mortality, and migration. The latest projections from the UNPD (chart #1) show that the world population could reach 9.7 billion by 2050 and 10.9 billion by 2100 under the medium-variant scenario, which

World Population Growth Rate Chart

Market And Economic Cycle Phases

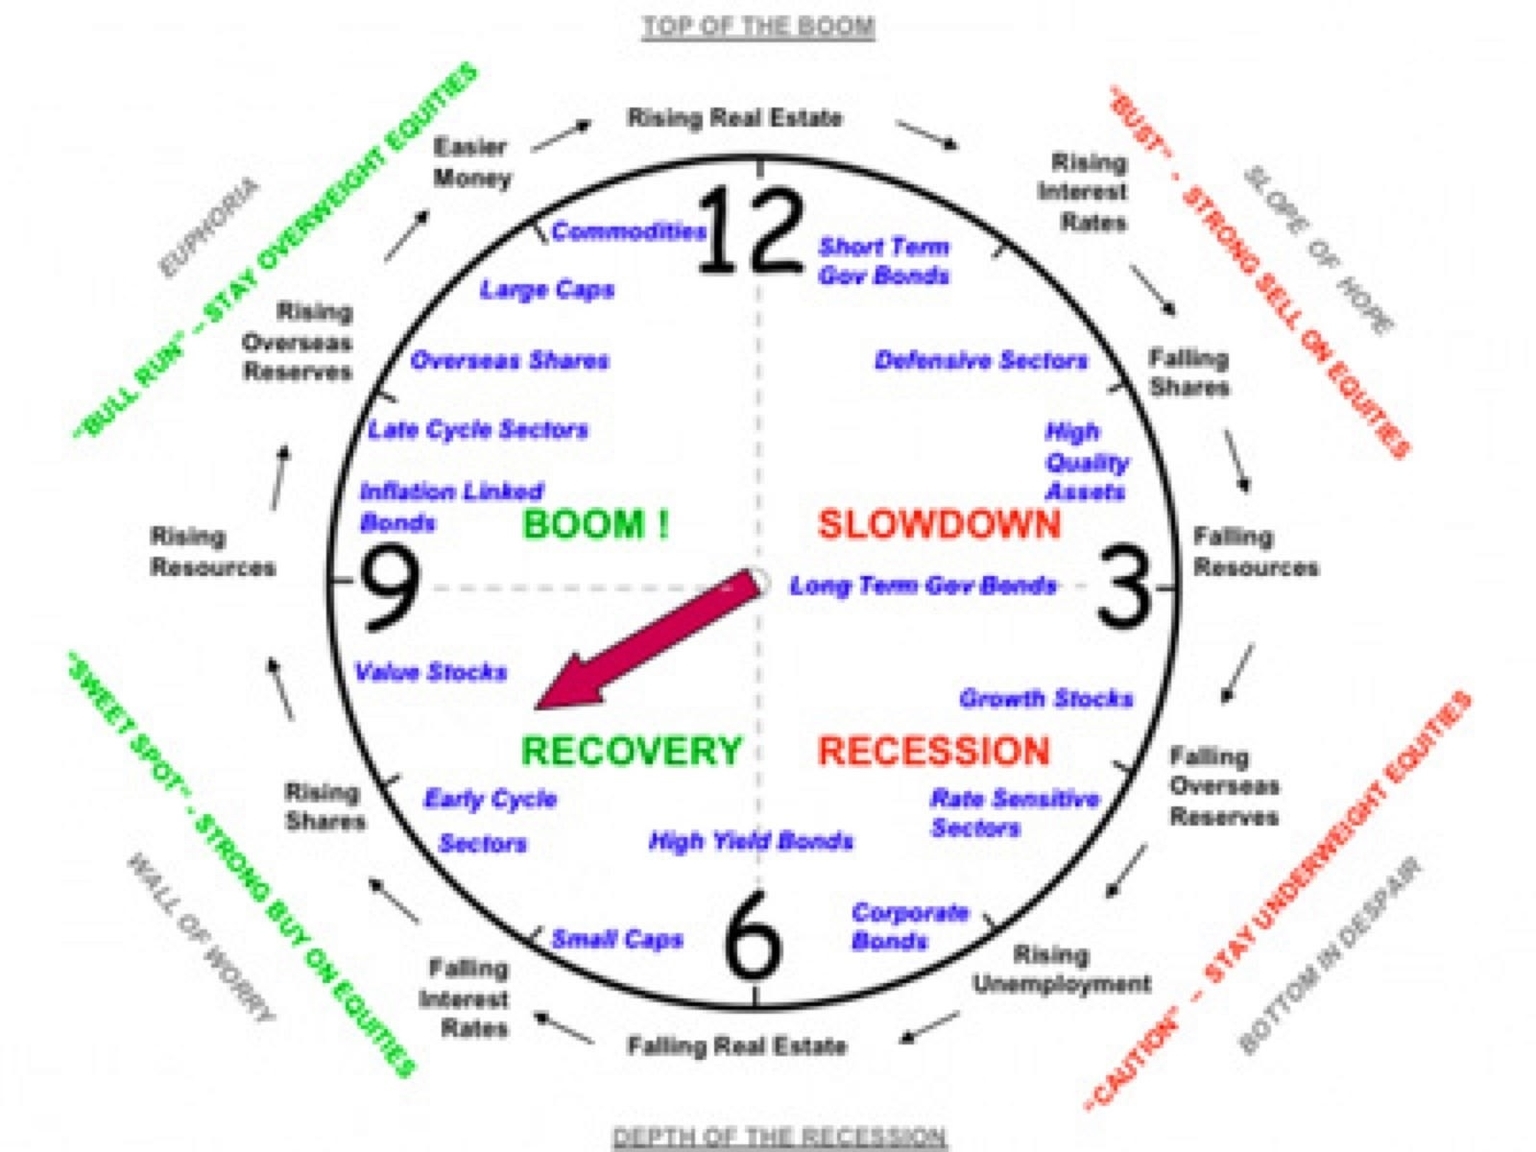
The economic cycle is a term used to describe the fluctuations in economic activity that occur over time. It is also known as the business cycle and is characterized by four stages: expansion, peak, contraction, and trough . The duration of each stage can vary, and the cycle can be influenced by a variety of factors, including gross domestic product (GDP), interest rates, total employment, and consumer spending .

During the expansion phase, the economy experiences relatively rapid growth, interest rates tend to be low, and production increases. The economic indicators associated with growth, such as employment and wages, corporate profits and output, aggregate demand, and the supply of goods and services, tend to show sustained uptrends through the expansionary stage. The flow of money through the economy remains healthy and the cost of money is cheap. However, the increase in the money supply may spur inflation during the economic growth phase .

The peak of a cycle is when growth hits its maximum rate. Prices and economic indicators may stabilize for a short period before reversing to the downside. Peak growth typically creates some imbalances in the economy that need to be corrected. As a result, businesses may start to reevaluate their budgets and spending when they believe that the economic cycle has reached its peak .

A correction occurs when growth slows, employment falls, and prices stagnate. As demand decreases, businesses may not immediately adjust production levels, leading to oversaturated markets with surplus supply and a downward movement in prices. If the contraction continues, the recessionary environment may spiral into a depression .

The trough of the cycle is reached when the economy hits a low point, with supply and demand hitting bottom before recovery. The low point in the cycle represents a painful moment for the economy, with a widespread negative impact from stagnating spending and income .

It is important to note that the causes of a cycle are highly debated among different schools of economics . Understanding the economic period can help investors and businesses determine when to make investments and when to pull their money out, as each cycle impacts stocks and bonds as well as profits and corporate earnings .

Market And Economic Cycle Phases

Chemical Structure Illustration

Chemical structure illustration is a visual representation of the molecular structure of a chemical compound. It is a way to depict the arrangement of atoms and bonds in a molecule. Chemical structure illustrations are used in various fields such as chemistry, biochemistry, pharmacology, and material science. They are used to communicate the structure of a molecule to other scientists, students, and the general public.

There are different types of chemical structure illustrations, including line structures, condensed structures, and three-dimensional structures. Line structures are the most basic type of chemical structure illustration. They use lines to represent bonds between atoms and do not show the three-dimensional shape of the molecule. Condensed structures are a more compact way of representing molecules. They use brackets and parentheses to indicate groups of atoms that are bonded together. Three-dimensional structures are the most complex type of chemical structure illustration. They show the three-dimensional shape of the molecule and the spatial arrangement of the atoms.

Chemical structure illustrations are created using specialized software such as ChemDraw, MarvinSketch, and Avogadro. These software tools allow chemists to draw and manipulate chemical structures with ease. They also provide features such as 3D visualization, stereochemistry, and isomerism. Chemical structure illustrations can also be created using online tools such as MolView and PubChem Sketcher.

Chemical structure illustrations are used in various applications such as drug discovery, material science, and environmental science. In drug discovery, chemical structure illustrations are used to design and optimize new drugs. They are also used to study the structure-activity relationship of drugs. In material science, chemical structure illustrations are used to design new materials with specific properties. In environmental science, chemical structure illustrations are used to study the fate and transport of chemicals in the environment.

In conclusion, chemical structure illustration is an important tool for chemists and scientists in various fields. It allows them to communicate the structure of a molecule in a clear and concise manner. With the help of specialized software and online tools, creating chemical structure illustrations has become easier than ever before. [^5^

Chemical Structure Illustration

Harappa Diagram

Harappa is an ancient city that was part of the Indus Valley Civilisation, one of the oldest and most advanced civilisations in the world. Harappa was located in what is now Punjab, Pakistan, near the Ravi River. It was a large and prosperous city, with a population of about 23,500 people, a sophisticated urban planning, and a rich culture. Here is a brief overview of Harappa in about 1000 words:

Harappa was founded around 2500 BCE, during the Early Harappan phase of the Indus Valley Civilisation. It was one of the first cities to emerge in South Asia, along with Mohenjo-daro, another major city of the civilisation. Harappa and Mohenjo-daro shared many similarities in their architecture, layout, and culture, suggesting a high degree of coordination and integration among the Indus cities. Harappa was also connected to other regions through trade and cultural exchange, such as Mesopotamia, Central Asia, and the Persian Gulf.

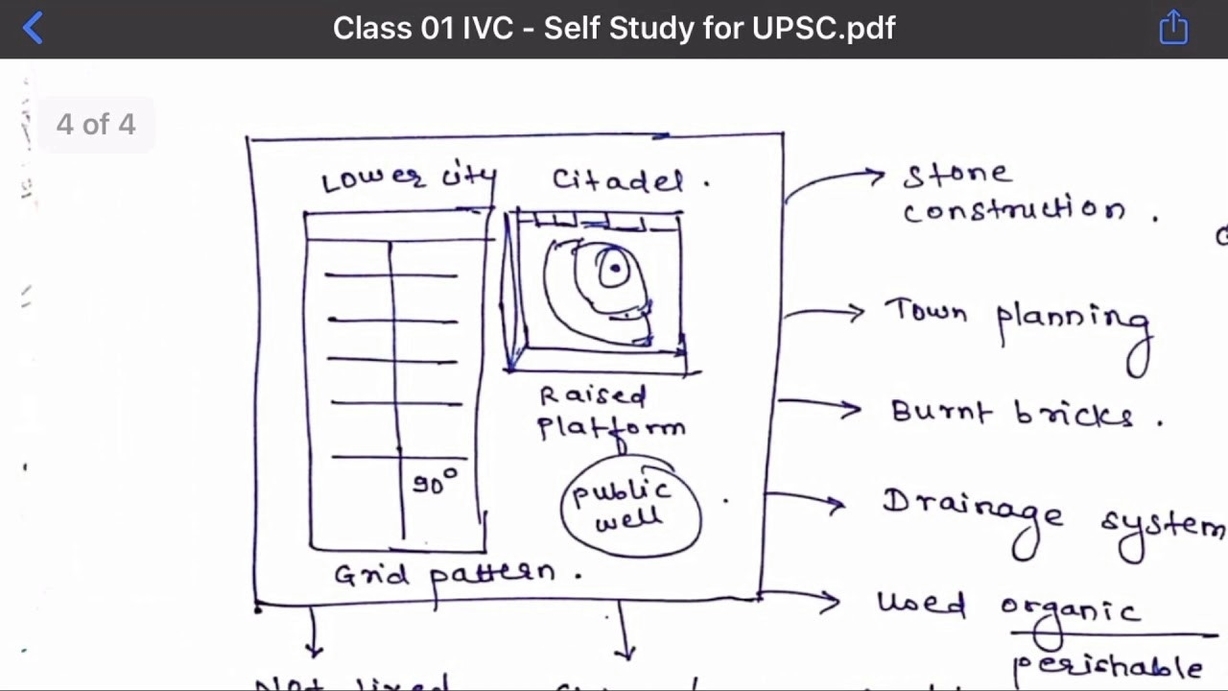
Harappa reached its peak of development and influence during the Mature Harappan phase, from 2600 BCE to 1900 BCE. During this period, Harappa expanded to cover an area of about 150 hectares (370 acres), making it one of the largest cities in the ancient world. Harappa had a well-planned urban design, with a grid-like pattern of streets, a fortified citadel, and a lower town. The citadel was the administrative and religious centre of the city, where the elites and the priests lived and worked. The lower town was the residential and commercial area, where the common people lived in brick houses with flat roofs, courtyards, and drainage systems. Harappa also had public buildings and facilities, such as granaries, warehouses, workshops, baths, and wells.

Harappa had a complex and diverse culture, with a distinctive writing system, art, religion, and technology. The Harappan script, which has not been deciphered yet, was used to write on seals, tablets, pottery, and other objects. The Harappan art, which was mainly made of terracotta, stone, metal, and shell, depicted animals, plants, humans, and geometric patterns. The Harappan religion, which was polytheistic and animistic, involved the worship of various gods and goddesses, as well as natural forces and elements. The Harappan technology, which was advanced for its time, included metallurgy, pottery, textiles, weights and measures, and sanitation.

Harappa declined and collapsed around 1900 BCE, during the Late Harappan phase of the Indus Valley Civilisation. The reasons for the decline and collapse are not clear, but some possible factors are environmental changes,

Harappa Diagram

Demographic Trends

Demoic Trends is a term that refers to the increasing popularity and visibility of occult practices, beliefs, and aesthetics in contemporary culture, especially on social media platforms such as YouTube, TikTok, and Twitter. Some examples of Demoic Trends are:

– WitchTok: a subculture of TikTok users who identify as witches, share spells, rituals, tips, and experiences related to witchcraft, and often use hashtags such as #witchtok, #witchesoftiktok, and #babywitch.
– Solomonic magic: a tradition of ceremonial magic that claims to derive from the teachings of King Solomon, the biblical king who was said to have power over demons and spirits. Solomonic magicians use grimoires, talismans, pentacles, and other tools to summon, command, or banish entities.
– Demonic Trends: a Minecraft marketplace pack that features demonic-themed skins, items, and maps for players who want to explore the dark side of the game. The pack includes 12 skins, such as Demon Hunter, Succubus, and Hellhound, and a custom world with a portal to the Nether.

Demoic Trends can be seen as a reflection of the interest and curiosity that many people have towards the occult, the supernatural, and the unknown. Some possible reasons for this fascination are:

– The desire for empowerment, control, or self-expression in a chaotic and uncertain world. Many people who practice occultism claim that it gives them a sense of agency, purpose, and identity, as well as a way to cope with personal or social challenges.
– The appeal of mystery, fantasy, and creativity. Many people who engage with occultism enjoy the aesthetic, artistic, and imaginative aspects of it, as well as the opportunity to explore alternative realities, histories, and perspectives.
– The influence of popular culture, media, and technology. Many people who encounter occultism are exposed to it through books, movies, games, and online platforms that depict or promote it in various ways, often

Demographic Trends

Sustainable Agriculture Diagram 36

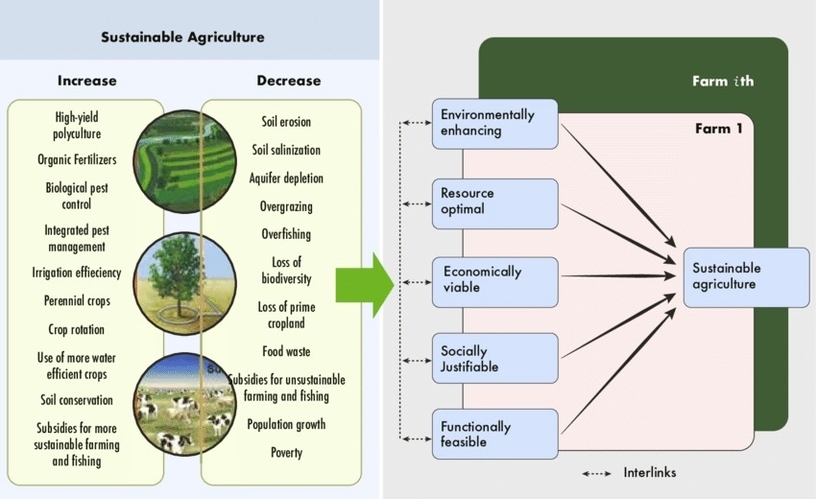
Sustainable agriculture is a farming system that aims to provide the resources necessary for present human populations while conserving the planet’s ability to sustain future generations. It focuses on promoting socioeconomic equity, earning profit, and maintaining ecosystem health. It also addresses the drawbacks of industrial agriculture, such as biodiversity loss, water pollution, and animal welfare .
ustainable agriculture is based on the principles of agroecology, which emphasizes the interdependence of ecological, social, and economic systems. It is a holistic approach to farming that considers the entire ecosystem, including soil, water, air, plants, animals, and humans. Sustainable agriculture seeks to balance the needs of the environment, society, and economy by promoting practices that are environmentally sound, socially responsible, and economically viable .

One of the key tenets of sustainable agriculture is the promotion of biodiversity. This involves planting diverse crops, including heirloom plants, which are often suited to a region’s particular climate. Rather than relying on a single crop in industrial monoculture, sustainable agriculture advocates the use of polyculture, in which multiple crops are grown together. Although polyculture is frequently more labour-intensive than industrial monoculture, it can reduce the need for chemical pesticides and fertilizers and generally improves soil quality. Similarly, crop rotation can help preserve soil productivity and lessen the need for agricultural chemicals for fertilization and pest control. The use of nitrogen-fixing cover crops, smother crops, and green manures can help restore soils and reduce erosion .
ustainable agriculture also emphasizes the importance of conserving water resources. This can be achieved through the use of drip irrigation, which delivers water directly to the roots of plants, reducing water waste. Similarly, the use of rainwater harvesting systems can help capture and store rainwater for later use. Sustainable agriculture also promotes the use of water-efficient crops and the reduction of water-intensive crops, such as rice, in areas with limited water resources .

Another important aspect of sustainable agriculture is the promotion of animal welfare. Sustainable agriculture advocates for the use of humane animal husbandry practices, such as free-range grazing and the use of natural feed. It also discourages the use of antibiotics and hormones in animal feed, which can have negative

Sustainable Agriculture Diagram 36

Art History Timelineart History Periods

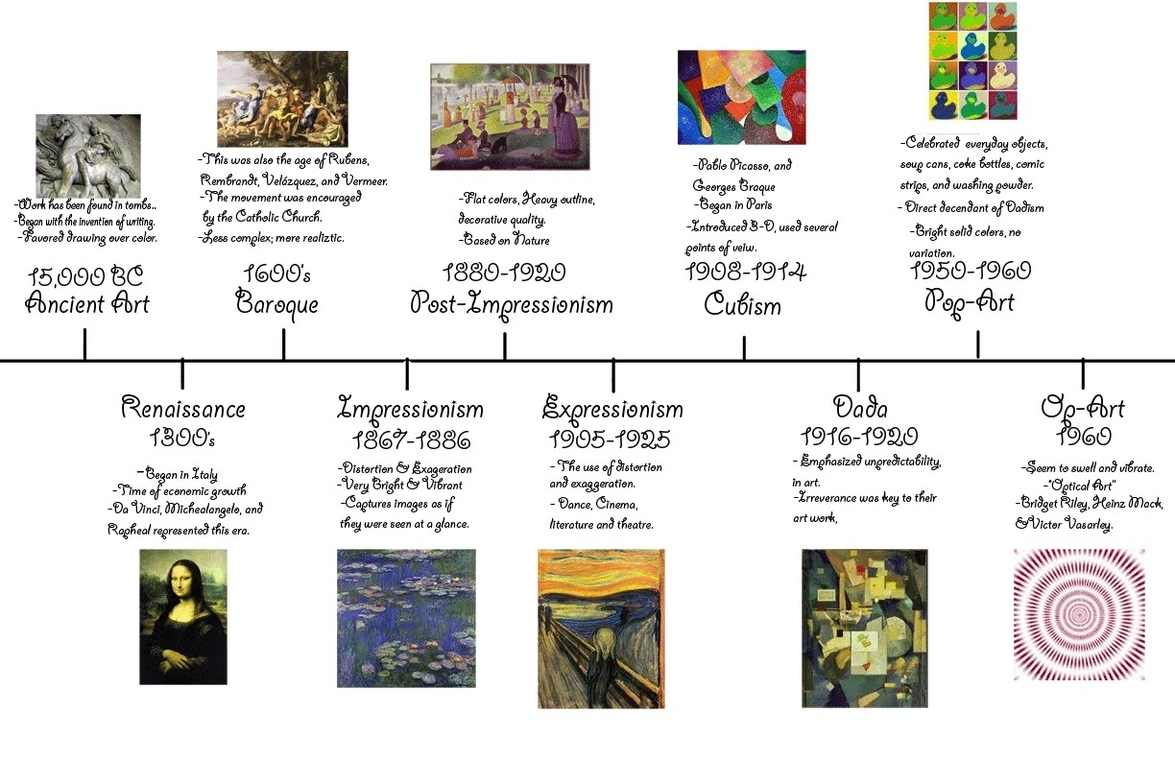
Art history is the study of the visual arts, their development, and their impact on human culture and society. Art history covers a wide range of periods and styles, from the ancient to the contemporary, and from the realistic to the abstract. Here is a brief overview of some of the major art history periods and their characteristics:

– Ancient Art (before 500 CE): This period includes the art of ancient civilizations, such as Egypt, Greece, Rome, China, India, and others. Ancient art reflects the beliefs, values, and practices of these cultures, and often depicts gods, myths, rulers, and everyday life. Ancient art is usually characterized by naturalism, symmetry, and geometric patterns.
– Medieval Art (500-1400 CE): This period encompasses the art of the Middle Ages, which was influenced by Christianity, Islam, and Byzantium. Medieval art is often religious, symbolic, and stylized, and includes architecture, sculpture, painting, and manuscript illumination. Medieval art is usually divided into sub-periods, such as Early Christian, Romanesque, and Gothic.
– Renaissance Art (1400-1600 CE): This period marks the rebirth of classical learning and art in Europe, especially in Italy. Renaissance art is inspired by ancient Greek and Roman art, and emphasizes humanism, realism, perspective, and individual expression. Renaissance art includes painting, sculpture, architecture, and printmaking, and features artists such as Leonardo da Vinci, Michelangelo, Raphael, and Botticelli.
– Baroque

Art History Timelineart History Periods