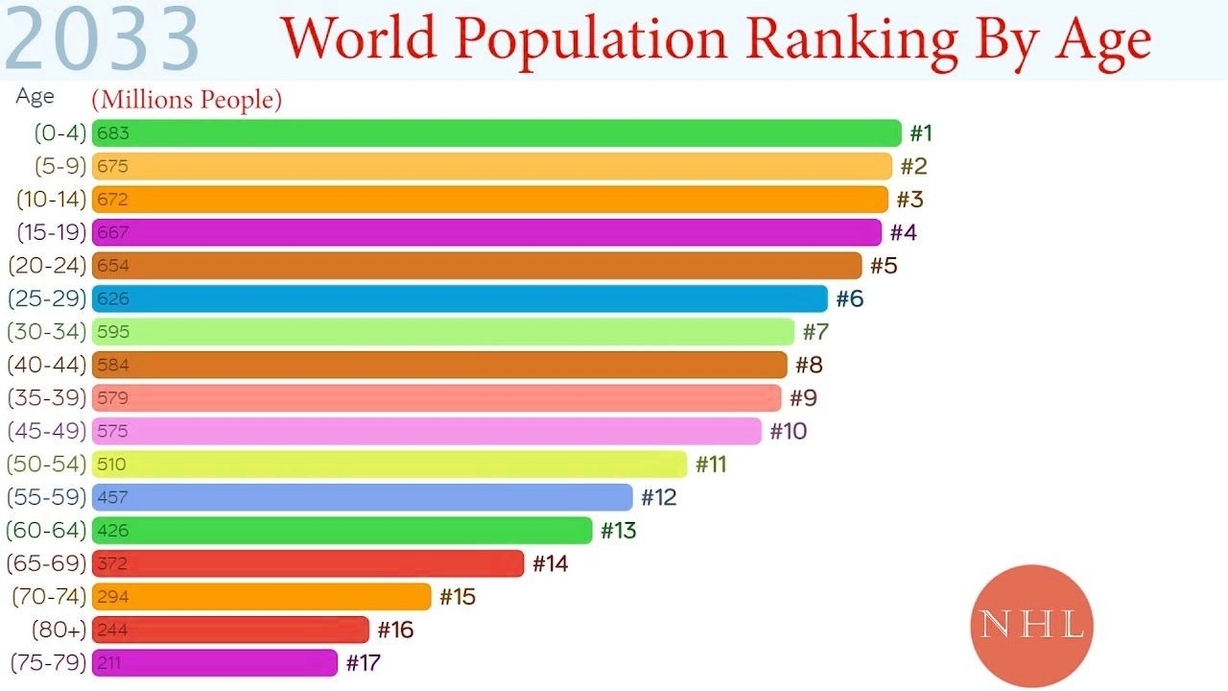
Age demographics refer to the distribution of people by age groups in a population. Age demographics are important for understanding the past, present, and future trends of population growth, development, and well-being. Different age groups have different needs, preferences, and behaviors that affect various aspects of society, such as health, education, economy, politics, and culture.
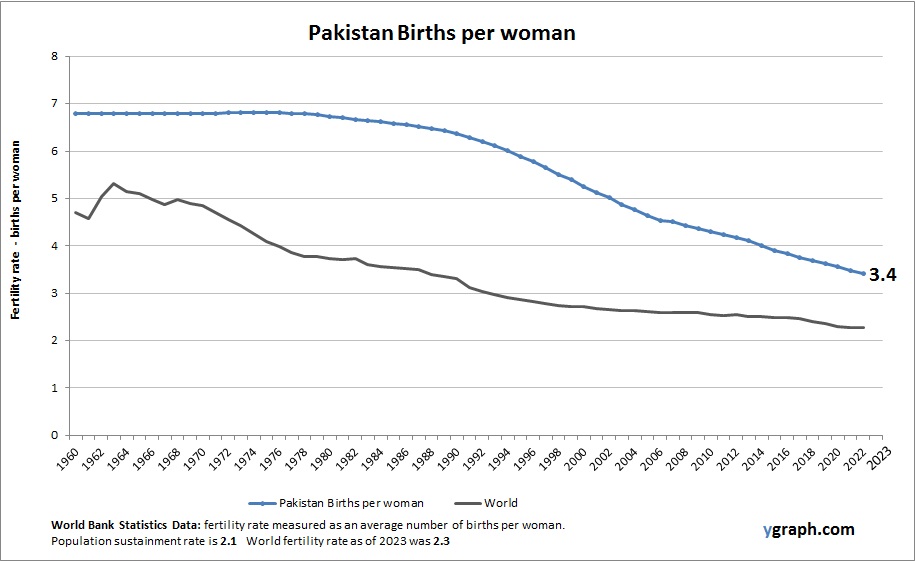
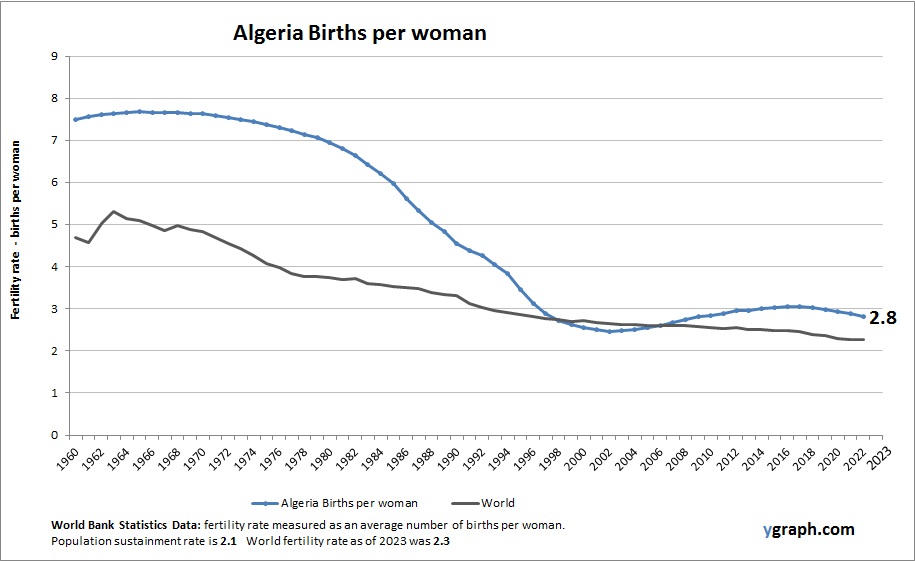
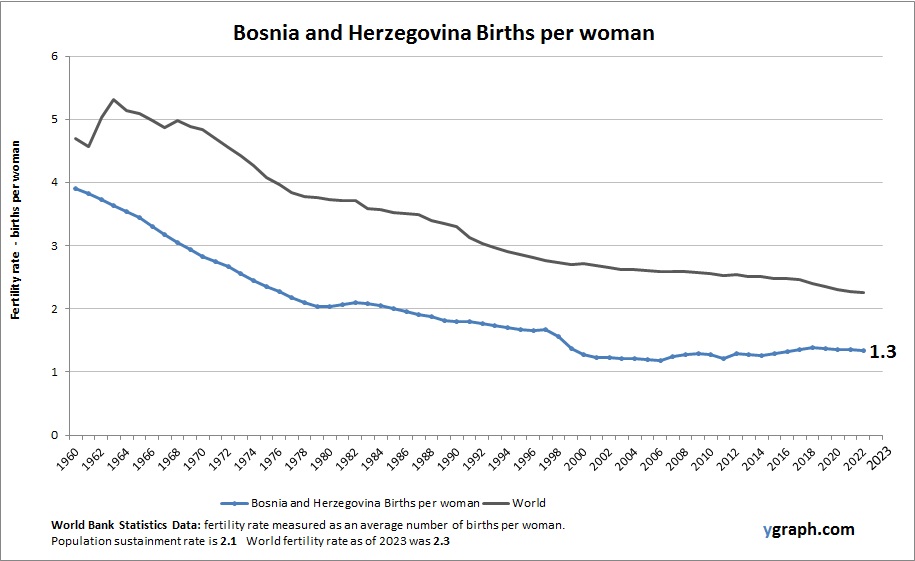
One of the most striking changes in age demographics worldwide is the increase in the median age, which is the age that divides the population into two equal halves. The global median age has increased from just over 20 years in 1970 to just over 30 years in 2022. This means that half of the world population is older than 30 years, and half is younger. The main drivers of this increase are the decline in fertility rates and the improvement in life expectancy. Fertility rates measure the average number of children per woman, and they have fallen from around 5 in 1970 to around 2.5 in 2022. Life expectancy measures the average number of years a person can expect to live, and it has risen from around 60 in 1970 to around 72 in 2022.
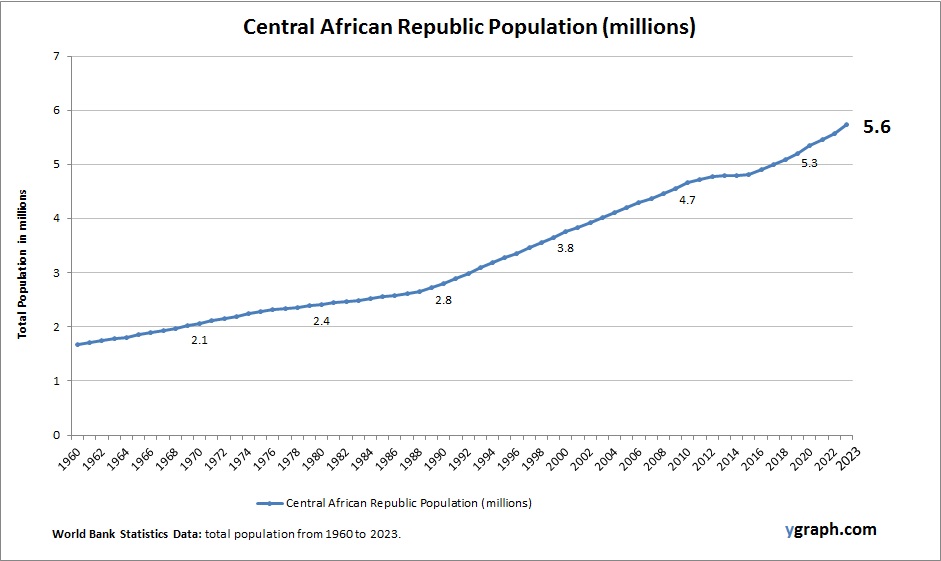
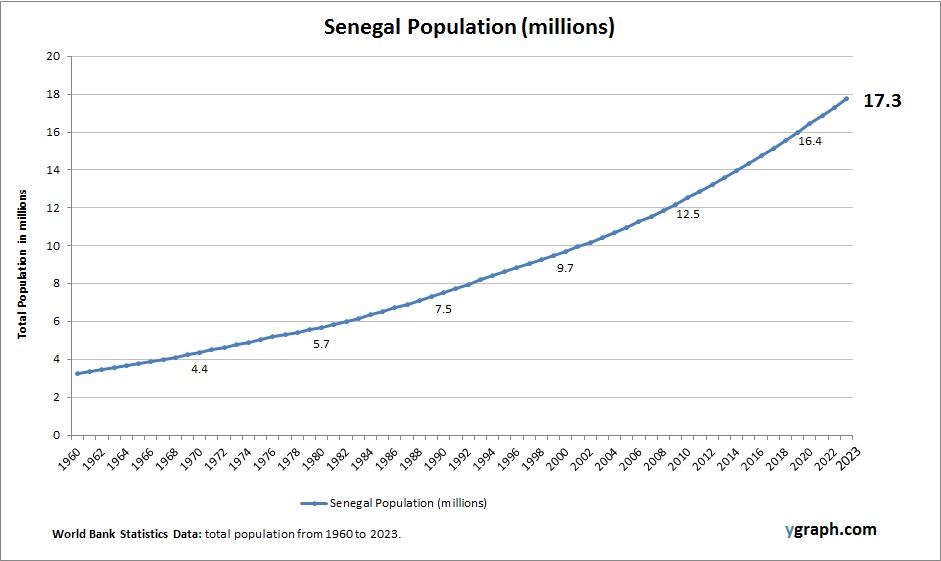
The increase in the median age has different implications for different regions and countries. Some regions, such as Africa, have a very young population, with a median age of around 20 years. This means that 40% of the population is below 15 years, and less than 3% is above 65. A young population can offer a potential demographic dividend, which is the economic benefit that arises when a large share of the population is in the working age bracket (usually between 15 and 64 years). However, this also poses challenges for providing adequate health, education, and employment opportunities for the young people, as well as ensuring social and political stability.
Other regions, such as Europe, have a very old population, with a median