Top Charts, Graphs and Diagrams

Featured

Smart Agriculture Ai & Iiot Solutions

Smart agriculture is the application of technologies such as artificial intelligence (AI), the Internet of Things (IoT), and cloud computing to improve the efficiency, productivity, and sustainability of farming practices. Smart agriculture aims to address the challenges of increasing food demand, climate change, labor shortage, and environmental impact in the agriculture sector. Here is a brief overview of how AI, IoT, and cloud computing can enable smart agriculture solutions:

– AI is the ability of machines to perform tasks that normally require human intelligence, such as perception, reasoning, learning, decision making, and problem solving. AI can help farmers to analyze data from various sources, such as sensors, satellites, drones, weather stations, and historical records, to optimize crop growth, yield, and quality. AI can also assist farmers in detecting pests, diseases, weeds, and nutrient deficiencies, and provide recommendations for the best management practices. AI can also automate tasks such as irrigation, fertilization, harvesting, and sorting, by using robots, drones, or autonomous vehicles.

– IoT is the network of physical objects that are embedded with sensors, software, and other technologies that enable them to communicate and exchange data with other devices and systems over the internet. IoT can help farmers to monitor and control various aspects of their farms, such as soil moisture, temperature, humidity, pH, light, water level, and crop health, by using smart devices and wireless communication. IoT can also help farmers to track and manage their livestock, equipment, and resources, by using RFID tags, GPS, and cameras. IoT can also help farmers to reduce waste, energy consumption, and greenhouse gas emissions, by using smart meters, valves, and switches.

– Cloud computing is the delivery of computing services, such as servers, storage, databases, software, analytics, and intelligence, over the internet. Cloud computing can help farmers to store, process, and access large amounts of data from various sources, such as sensors, satellites, drones, weather stations, and historical records, by using cloud platforms and applications. Cloud computing can also help farmers to share and collaborate with other stakeholders, such as researchers, extension agents, suppliers, and consumers, by using cloud services and tools. Cloud computing can also help farmers to scale up or down their computing resources, depending on their needs and budget, by using cloud models and pricing.

In conclusion, smart agriculture is the integration of AI, IoT, and cloud computing technologies to enhance the performance and profitability of farming practices. Smart agriculture can benefit farmers by providing them with data-driven insights, recommendations, and automation, to improve their decision making, efficiency, and sustainability. Smart agriculture can also benefit the society and the environment by increasing food security, quality, and safety, while reducing resource consumption, waste, and pollution. Smart agriculture is expected to be a key driver for the digital transformation and innovation of

Smart Agriculture Ai & Iiot Solutions

Us Population By Age And Generation In 2020

The US population by age and generation in 2020 is a topic that can be explored using various sources of data, such as the Census Bureau, the United Nations, and other research organizations. Here is a summary of some key facts and trends based on the web search results:

– The US population in 2020 was estimated to be about 331 million people, with an average age of 38.4 years.
– The largest generation in the US in 2020 was Gen-Z, which includes people born from 2000 to 2020. Gen-Z accounted for about 26% of the total population, or 86 million people.
– The second-largest generation was Millennials, which includes people born from 1981 to 1999. Millennials made up about 25% of the population, or 83 million people.
– The third-largest generation was Baby Boomers, which includes people born from 1946 to 1964. Baby Boomers represented about 21% of the population, or 69 million people.
– The other generations in the US in 2020 were Gen-X (born from 1965 to 1980), Silent Gen (born from 1928 to 1945), and Greatest Gen (born before 1928). They accounted for 20%, 7%, and 1% of the population, respectively.
– The US population by age and generation in 2020 was influenced by various factors, such as birth rates, mortality rates, immigration, and social and economic changes. Some of the notable trends include:
– The aging of the Baby Boomers, who reached their retirement age and increased the share of older adults in the population.
– The decline of the birth rate, which resulted in a lower share of children and young adults in the population.
– The increase of the immigration rate, which contributed to the growth and diversity of the population, especially among Gen

Us Population By Age And Generation In 2020

Attrition In Coastal Landscapes

Attrition is one of the key processes that shapes the coastal landscape. It is a process of erosion that occurs when rocks and pebbles carried by waves smash into each other, and against the seabed and the base of a cliff or rocky outcrop. Through this action, the rocks and pebbles are worn away, becoming smaller, rounder and smoother .

The process of attrition is caused by the force of the waves, which get their energy from the wind. The size of the wave is determined by the speed of the wind, the length of time the wind has been blowing, and the distance of sea it has travelled over (the fetch). The stronger the wave, the more erosion it will cause .

There are four main processes of coastal erosion: corrasion, abrasion, hydraulic action, and attrition. Corrasion is when destructive waves pick up beach material (e.g. pebbles) and hurl them at the base of a cliff. Abrasion, also called corrasion, is the process of rocks and pebbles carried by the waves wearing away rocks as they are thrown against cliffs. Hydraulic action is the sheer force of waves crashing against the shore and cliffs. Finally, attrition happens when rocks and pebbles carried by the waves smash into each other, wearing each other away and gradually becoming smaller, rounder and smoother .

Coastal landscapes are formed by a combination of erosion, transportation, and deposition processes. They each have distinctive features which can be identified on an OS map. For Higher Geography study the formation of erosion and depositional features in coastal landscapes and identify features on an OS map .

Attrition In Coastal Landscapes

Us Economy In Charts

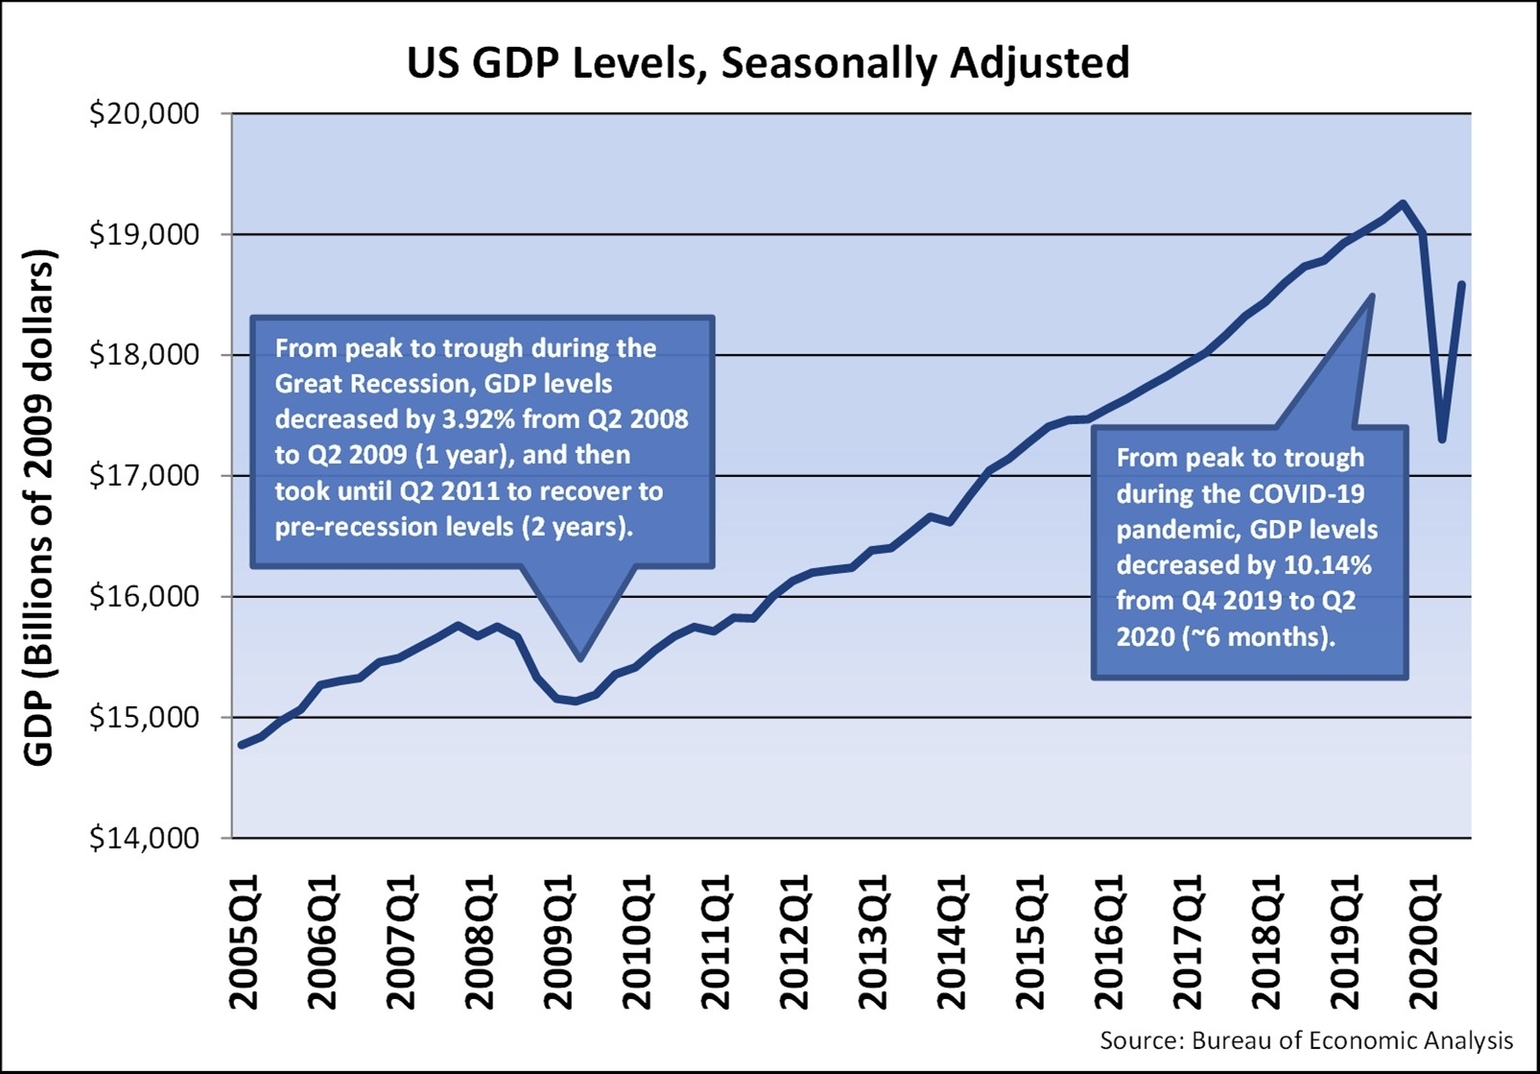
The US economy is one of the largest and most influential economies in the world. It is a mixed economy, which means that it has both private and public sectors. The private sector is responsible for most of the economic activity, while the public sector provides essential services such as education, healthcare, and infrastructure.

The US economy has been growing steadily over the past few years, with a GDP of $22.7 trillion in 2023 . However, there are concerns that the economy may be slowing down due to rising interest rates and inflation . The Federal Reserve has been raising interest rates to combat inflation, which has led to higher borrowing costs for businesses and consumers . This has caused some businesses to cut back on investment and hiring, which could lead to slower economic growth in the future.

Despite these concerns, the US economy added 216,000 jobs in December 2023, which was more than expected . This is a positive sign for the labor market, which has been struggling with high interest rates and inflation. The unemployment rate remained steady at 3.9% in December 2023 .

The US economy is driven by several key industries, including finance, healthcare, technology, and manufacturing. The finance industry is one of the largest in the world, with New York City being a major financial hub . The healthcare industry is also a major contributor to the US economy, with an estimated $3.5 trillion in spending in 2023 . The technology industry is another important sector, with companies such as Apple, Google, and Microsoft being major players in the global market . Finally, the manufacturing industry is responsible for producing a wide range of goods, from automobiles to electronics .

In conclusion, the US economy is a mixed economy that has been growing steadily over the past few years. However, there are concerns that the economy may be slowing down due to rising interest rates and inflation. Despite these concerns, the labor market remains strong, with the economy adding more jobs than expected in December 2023. The US economy is driven

Us Economy In Charts

Us Economy

The United States of America has the world’s largest economy by nominal GDP and the second-largest by purchasing power parity (PPP) behind China . The country has a highly developed/advanced mixed economy with a diversified North American economy . The economy is driven by the service sector, which accounts for 80.2% of the GDP . The industrial sector contributes 18.9% to the GDP, while agriculture contributes 0.9% . The country’s major industries include petroleum, steel, motor vehicles, aerospace, telecommunications, chemicals, electronics, food processing, information technology, consumer goods, and lumber mining .

The United States dollar (USD) is the country’s currency and is widely used in international trade . The country is a member of several trade organizations, including the World Trade Organization (WTO), G-20, G7, OECD, USMCA, and APEC . The United States is also home to the world’s principal financial center, New York City .

The country’s nominal GDP was estimated to be $26.950 trillion in 2023, while its PPP was estimated to be $26.950 trillion in the same year . The country’s GDP per capita was $80,412 (nominal) and $80,412 (PPP) in 2023 . The country’s GDP growth rate was 2.1% in 2022 and is expected to be 2.1% in 2023 and 1.5% in 2024 .

The country’s labor force was estimated to be 161,200,000 in 2023, with an employment rate of 62.4% . The country’s unemployment rate was 3.4% in January 2023, with 10.4% youth unemployment (December 2022; 16 to 19-year-olds) . The average gross salary was $5,407 / €5,052 monthly in 2022, while the average net salary was $4,066 / €3,799 monthly in the same year .

The United States economy has been growing steadily over the years, with the country adding more jobs than expected in December 2023 . The country’s unemployment rate has remained below 4% for 23 consecutive months, the longest such run since the 1960s . The country’s inflation rate was 3% in 2023 .

In conclusion, the United States of America has a highly developed/advanced mixed economy with a diversified North American economy. The country’s economy is driven by the service sector, which accounts for 80.2% of the GDP. The country’s major industries include petroleum, steel, motor vehicles, aerospace, telecommunications, chemicals, electronics, food processing, information technology, consumer goods, and lumber mining. The country’s nominal GDP was estimated to be $26.950 trillion in 2023, while its PPP was estimated to be $26.950 trillion in the same year. The country’s GDP per capita was $80,412 (nominal) and $80,412 (PPP) in 2023. The country’s labor force was estimated to be 161,200,000 in 2023, with an employment rate of 62.4%. The country’s unemployment rate was 3.4% in January 2023, with 10.4% youth unemployment (December 2022; 16 to 19-year-olds

Us Economy

Timeline Powerpoint

Timeline PowerPoint is a feature in Microsoft PowerPoint that allows users to create a visual representation of events or milestones in chronological order. This feature is useful for creating presentations that require a timeline, such as project plans, historical events, or product roadmaps.

To create a timeline in PowerPoint, you can use the SmartArt graphic feature. Here are the steps to create a timeline using SmartArt:

1. Open PowerPoint and navigate to the slide where you want to add the timeline.
2. Click on the Insert tab and select SmartArt from the Illustrations group.
3. In the Choose a SmartArt Graphic window, select a timeline layout from the Process category. You can choose from a variety of timeline layouts, including basic timeline, circle accent timeline, and more.
4. Click on the OK button to insert the timeline into your slide.
5. Add text to the timeline by clicking on the [Text] placeholders and typing in your content. You can also use the Text Pane to add or edit text.
6. To add more dates to your timeline, click on a shape in the timeline and then click on the Add Shape button in the SmartArt Design tab. You can add shapes before or after the selected shape.
7. To move a date in your timeline, click on the shape and then click on the Move Up or Move Down button in the SmartArt Design tab.
8. To change the layout of your timeline, click on the timeline and then click on the More button in the SmartArt Design tab. You can choose from a variety of timeline and process-related layouts.
9. To change the colors of your timeline, click on the timeline and then click on the Change Colors button in the SmartArt Design tab. You can choose from a variety of color combinations.
10. To apply a SmartArt style to your timeline, click on the timeline and then click on the SmartArt Styles button in the SmartArt Design tab. You can choose from a variety of styles to give your timeline a professional

Timeline Powerpoint

Historical Diagrams 38

The Historical S-38 was an amphibious aircraft designed by Igor Sikorsky in the late 1920s. It was the first commercial success for Sikorsky’s company in America, and it served for various purposes such as air mail, passenger transport, exploration, and military operations. Here is a brief summary of the Historical S-38 in about 1000 words:

The Historical S-38 was a twin-engine, ten-seat sesquiplane, meaning that it had a smaller lower wing and a larger upper wing. It had two pontoons attached to the lower wing, which allowed it to take off and land on water as well as land. It also had a retractable landing gear for land operations. The S-38 was powered by two Pratt & Whitney Wasp radial engines, each producing 420 horsepower. The S-38 had a wingspan of 72 feet, a length of 40 feet, and a height of 15 feet. It had a maximum speed of 130 miles per hour, a cruising speed of 110 miles per hour, and a range of 800 miles. It could carry a crew of two and eight or nine passengers with baggage. It sold for $55,000 in 1928, which was a relatively low price for an amphibious aircraft at the time.

The S-38 was developed based on Sikorsky’s previous experience with the S-34 and S-36, which were experimental amphibious

Historical Diagrams 38

World Population

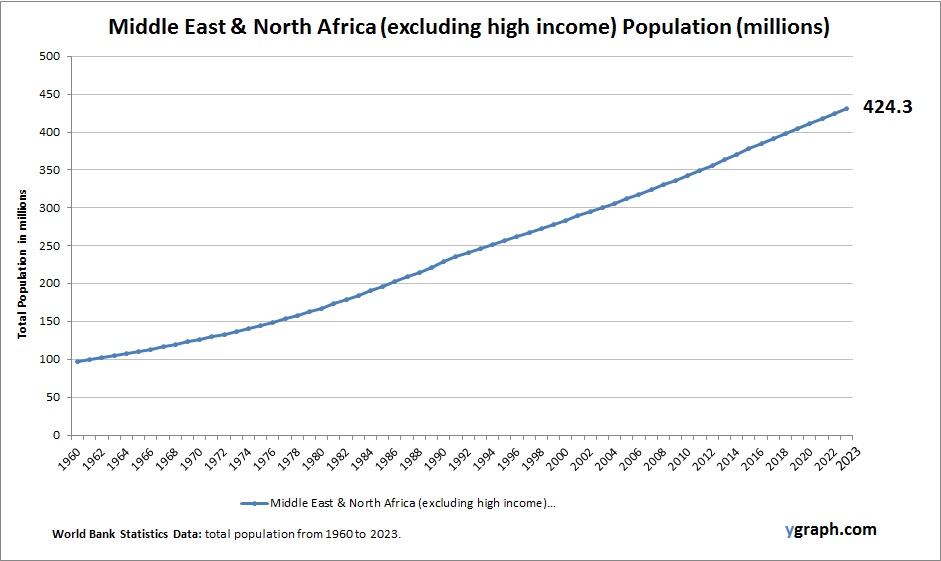
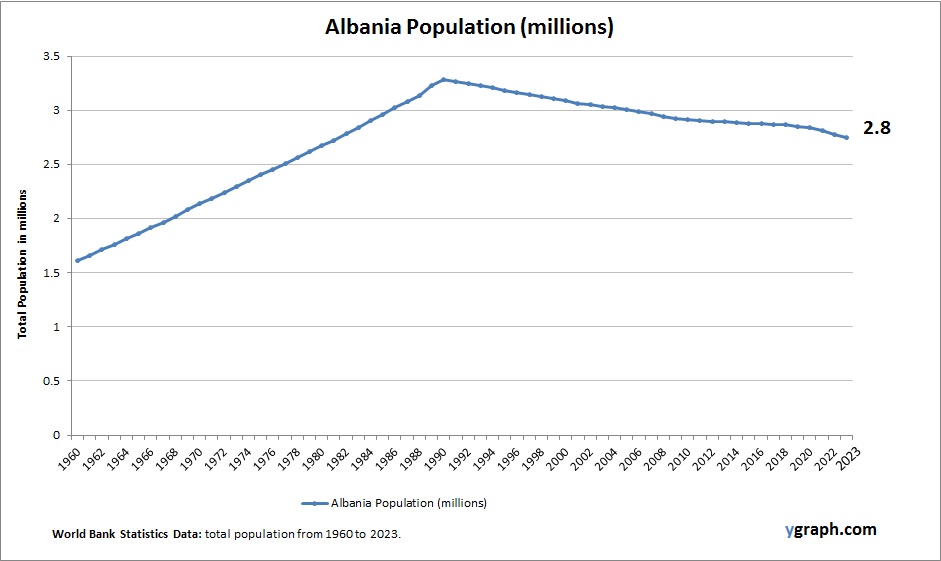
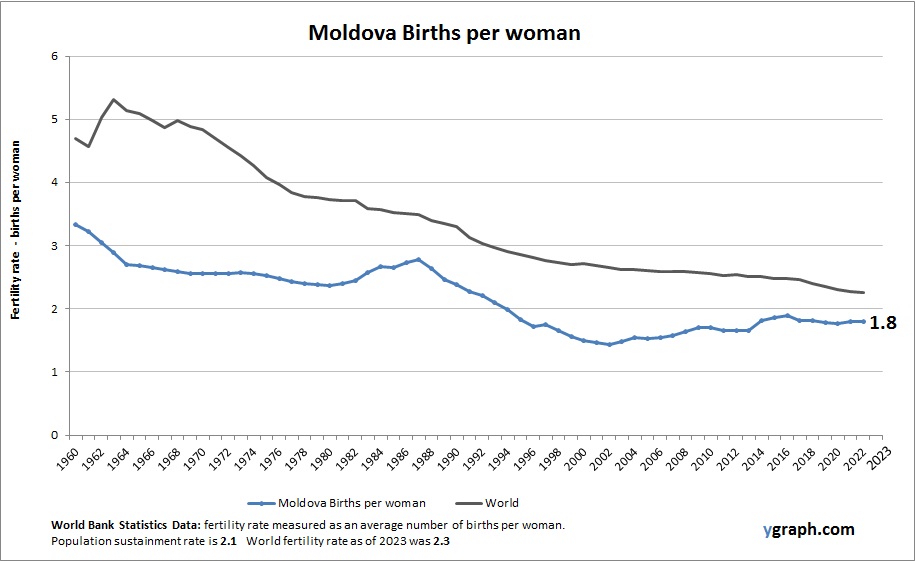
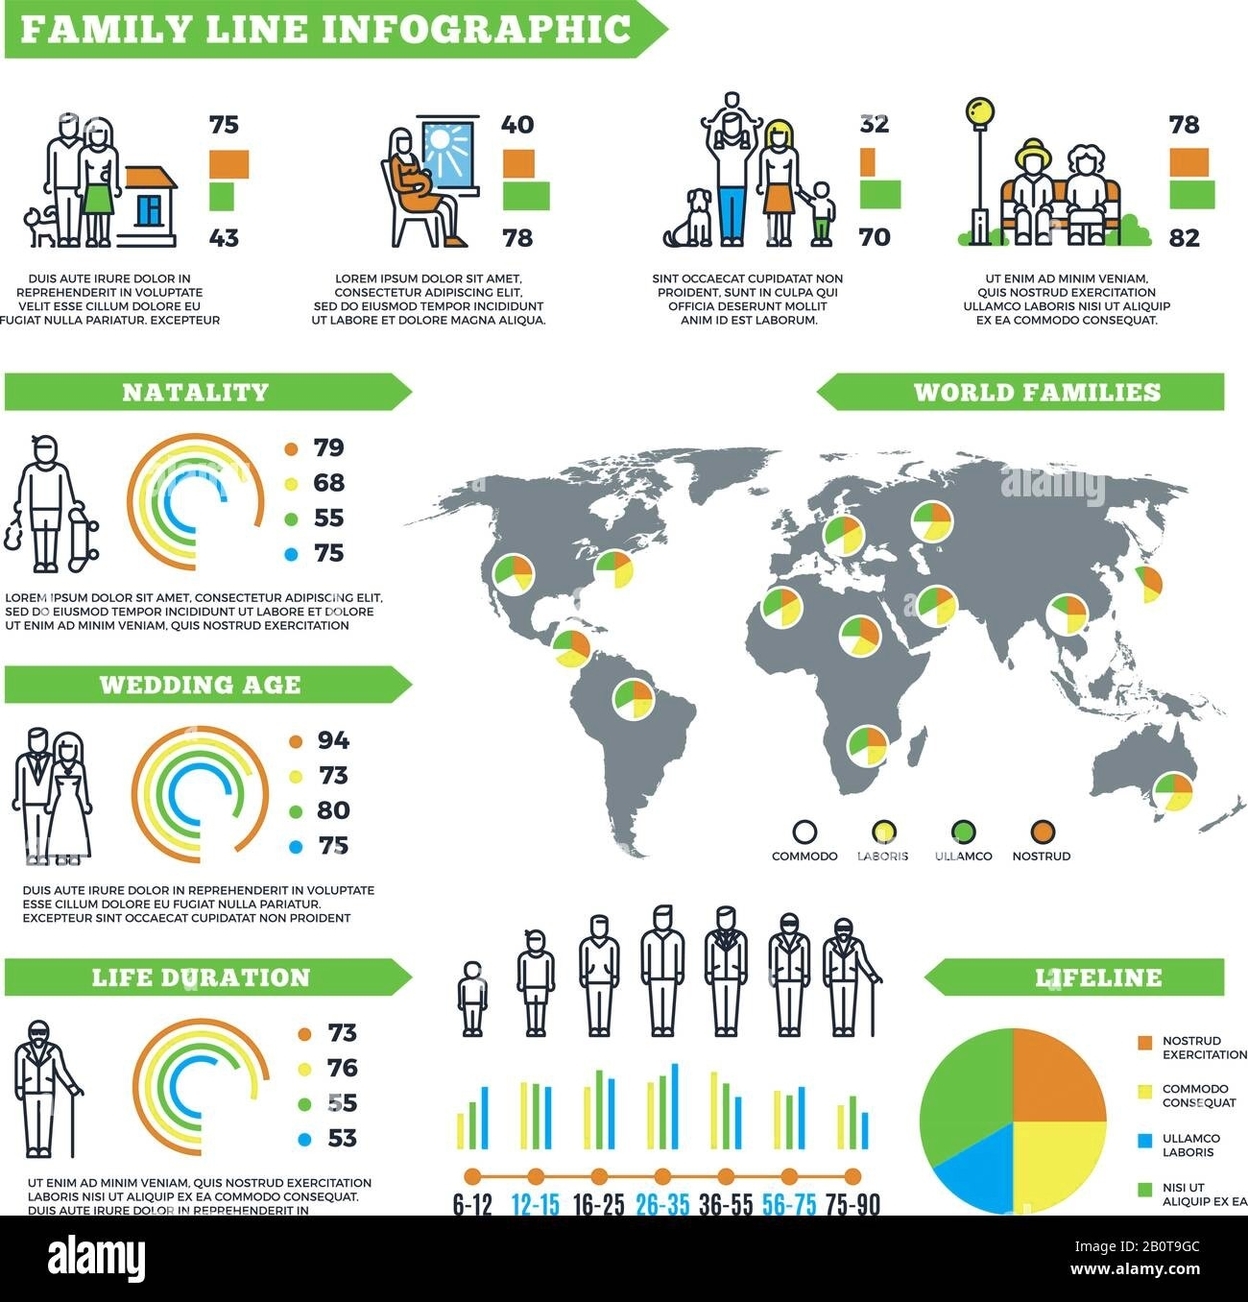
World population is the total number of humans currently living on Earth. According to the latest United Nations estimates, the world population is about 8.1 billion as of January 2024. The world population has grown rapidly in the past two centuries, reaching one billion in 1804 and seven billion in 2011. The growth rate, however, has slowed down in recent decades, due to declining fertility rates, aging populations, and increased life expectancy.

The world population is unevenly distributed across different regions and countries, with Asia accounting for nearly 60% of the total population, followed by Africa (17%), Europe (9%), Latin America and the Caribbean (8%), and North America (5%). China and India are the two most populous countries in the world, each with more than 1.4 billion people, or about 18% of the global population. The United States, Indonesia, Pakistan, Nigeria, and Brazil are the next five most populous countries, each with more than 200 million people.

The world population is also diverse in terms of demographic characteristics, such as age structure, sex ratio, population density, urbanization, and religion. The median age of the world population is 31 years, with Africa having the youngest population (19 years) and Europe having the oldest population (43 years). The sex ratio of the world population is 101 males per 100 females, with more males than females in Asia and more females than males in Europe. The population density of the world is 59 people per square kilometer, with the highest density in Asia (150 people per square kilometer) and the lowest density in Oceania (5 people per square kilometer). The urbanization rate of the world is 57%, with the highest urbanization in North America (83%) and the lowest urbanization in Africa (41%). The most practiced religions

World Population

Friction Free Body Diagram Inclined Plane

This is Bing. I can help you with writing an essay about friction free body on an inclined plane. Here is a possible outline and some content for your essay:

Introduction
– Define what is an inclined plane and what is a friction free body.
– Explain the purpose of studying the motion of a friction free body on an inclined plane.
– Provide a brief overview of the main concepts and equations involved in the analysis.

Body
– Describe the forces acting on a friction free body on an inclined plane, such as gravity, normal force, and net force.
– Use a free-body diagram to illustrate the forces and their components along the x and y axes.
– Apply Newton’s second law to derive the equation for the acceleration of the body along the x axis, which is a x = g sin ? a x = g sin ?, where g is the gravitational acceleration, and ? ? is the angle of the incline.
– Explain how the acceleration is independent of the mass of the body and only depends on the angle of the incline.
– Use kinematic equations to find the velocity and displacement of the body as functions of time, given the initial conditions.
– Discuss the conservation of energy principle and how it relates to the motion of the body on the inclined plane.
– Compare the motion of a friction free body on an inclined plane with the motion of a free-falling body and a body sliding on a horizontal surface.

Conclusion
– Summarize the main findings and results of the analysis.
– Highlight the advantages and limitations of the friction free body model and the inclined plane assumption.
– Suggest some possible applications and extensions of the topic, such as using different shapes of bodies, adding friction or other forces, or changing the orientation of the plane.

References
– Cite the sources used in the essay, such as textbooks, websites

Friction Free Body Diagram Inclined Plane

R Series Parallel Circuit Diagram

A series-parallel circuit is a combination of series and parallel circuits, where some components are connected in series and some are connected in parallel. This means that there are multiple paths for the current to flow through the circuit, and the total resistance, voltage, and current are not the same for all components. To analyze a series-parallel circuit, we need to apply the rules of series and parallel circuits to different parts of the circuit, and use complex numbers to represent the impedance, voltage, and current of each component.

Here is an example of a series-parallel circuit with three resistors and two capacitors:

![series-parallel circuit](^1^)

The impedance (Z) of a component is the ratio of the voltage (V) across it to the current (I) through it, and it depends on the frequency (f) of the AC source. The impedance of a resistor (R) is equal to its resistance, and it does not change with frequency. The impedance of a capacitor (C) is inversely proportional to the frequency and the capacitance, and it has a negative phase angle of 90 degrees. The impedance of an inductor (L) is directly proportional to the frequency and the inductance, and it has a positive phase angle of 90 degrees. The impedance of a component can be written in polar form as Z = |Z| ? ?, where |Z| is the magnitude and ? is the phase angle.

To find the impedance of each component in the circuit, we need to use the following formulas:

– Z_R = R
– Z_C = 1 / (2?fC) ? -90°
– Z_L = 2?fL ? 90°

We can also use the following table to organize the values of impedance, voltage, and current for each component:

| Component | Impedance (Z) | Voltage (V) | Current (I) |
|———–|—————|————-|————-|
| R_1 | | | |
| R_2 | | | |
| R_3 | |

R Series Parallel Circuit Diagram