Uk Political System: The United Kingdom operates as a constitutional monarchy and a unitary parliamentary democracy. The monarch serves as the head of state, while the Prime Minister is the head of government. The Parliament consists of two houses

Charts, Graphs and Diagrams
Uk Political System: The United Kingdom operates as a constitutional monarchy and a unitary parliamentary democracy. The monarch serves as the head of state, while the Prime Minister is the head of government. The Parliament consists of two houses
Chart above demonstrates Iraq Population. World Bank is the source of this population data. Latest population information for Iraq.
Iraq’s population has experienced steady growth over recent decades, driven largely by high fertility rates and a relatively young population. Urbanization continues to rise, particularly in cities like Baghdad, Basra, and Mosul, where job opportunities and services attract internal migration. Although past conflicts and instability affected demographic patterns, recent improvements in infrastructure and education are influencing migration trends and health outcomes, helping shape a more dynamic population structure.
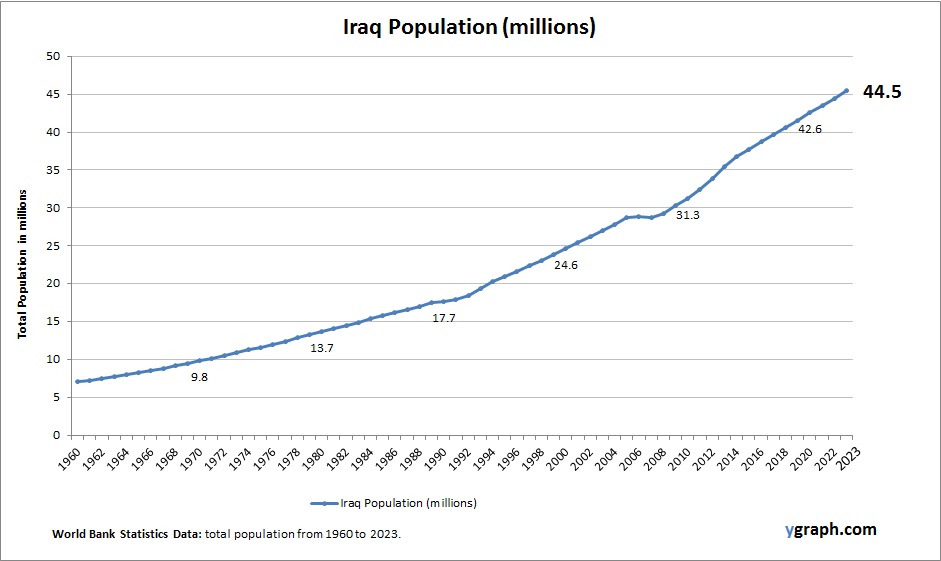
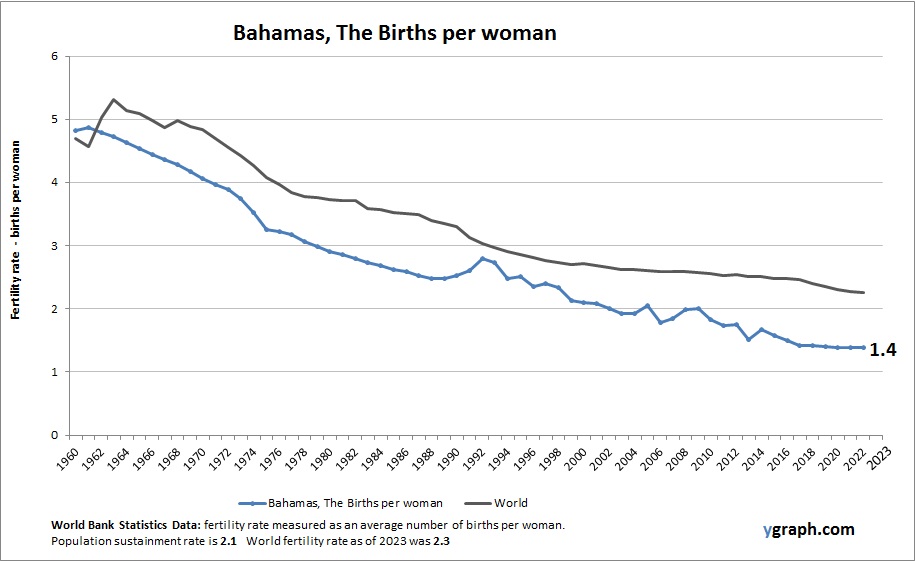
Chart above demonstrates Bahamas Births per woman. The fertility rate statistics are compiled by World Bank. Based on the latest demographics info provided for Bahamas.
The Bahamas has relatively low fertility rates for the Caribbean region, influenced by urbanization, education, and economic factors. Population growth is slow, with migration and tourism playing important roles in demographic dynamics. Challenges include aging populations and ensuring adequate social services.

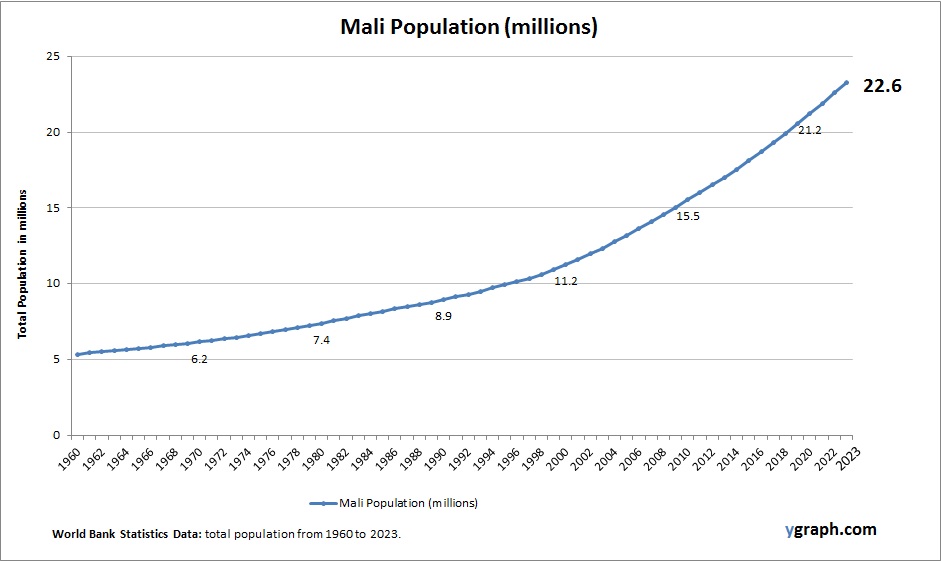
This diagram presents Mali Population. The country statistics are compiled by World Bank. Based on the latest available information for Mali.
Mali has a rapidly growing population due to very high fertility rates and a predominantly young demographic profile. Rural livelihoods and cultural norms support large family sizes, while urbanization and education are gradually influencing demographic changes.
Physics Diagram Explanation: Physics diagrams, such as circuit diagrams, use symbols to represent electrical components and their connections. These diagrams simplify complex circuits, making it easier to understand the flow of electricity and the function of each component.

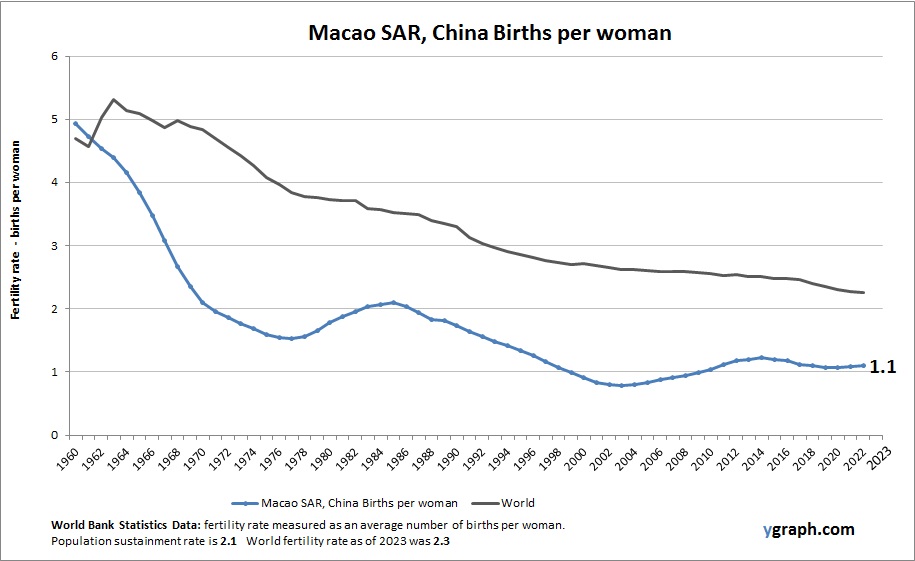
The above graph shows Macao SAR, China Births per woman. The fertility rate statistics are compiled by World Bank. Based on the latest demographics info provided for Macao SAR, China.
Macao has one of the lowest fertility rates in the world, reflecting high urban density, high living costs, and delayed childbearing. The population is largely sustained by migration rather than natural growth. Despite its small geographic size, Macaos population remains diverse and dynamic due to its role as a global tourism and business hub.
According to the 2021 Census conducted by Statistics Canada, the Canadian population is made up of various generations of different sizes, and each influences society according to their world view, characteristics, values and stage in their life cycle. The following table shows the percentage of the Canadian population by generation:
| Generation | Age Range | Percentage of Population |
|—————-|————–|——————————|
| Generation Alpha | 8 or younger | 5.8% |
| Generation Z | 9 – 24 | 18.2% |
| Millennials | 25 – 40 | 21.4% |
| Generation X | 41 – 55 | 19.1% |
| Baby Boomers | 56 – 75 | 24.9% |
| Interwar Generation | 76 – 93 | 7.3% |
The baby boomer generation, born between 1946 and 1965, make up less than a quarter of the Canadian population for the first time since the end of the baby boom. They represent 24.9% of the Canadian population, compared with 41.7% in 1966, when they were under the age of 20. Millennials, who are those born between 1981 and 1996, are the fastest-growing generation. Their numbers rose 8.6% between 2016 and 2021. They account for the largest share of the working-age population (33.2%), or those aged 15 to 64.
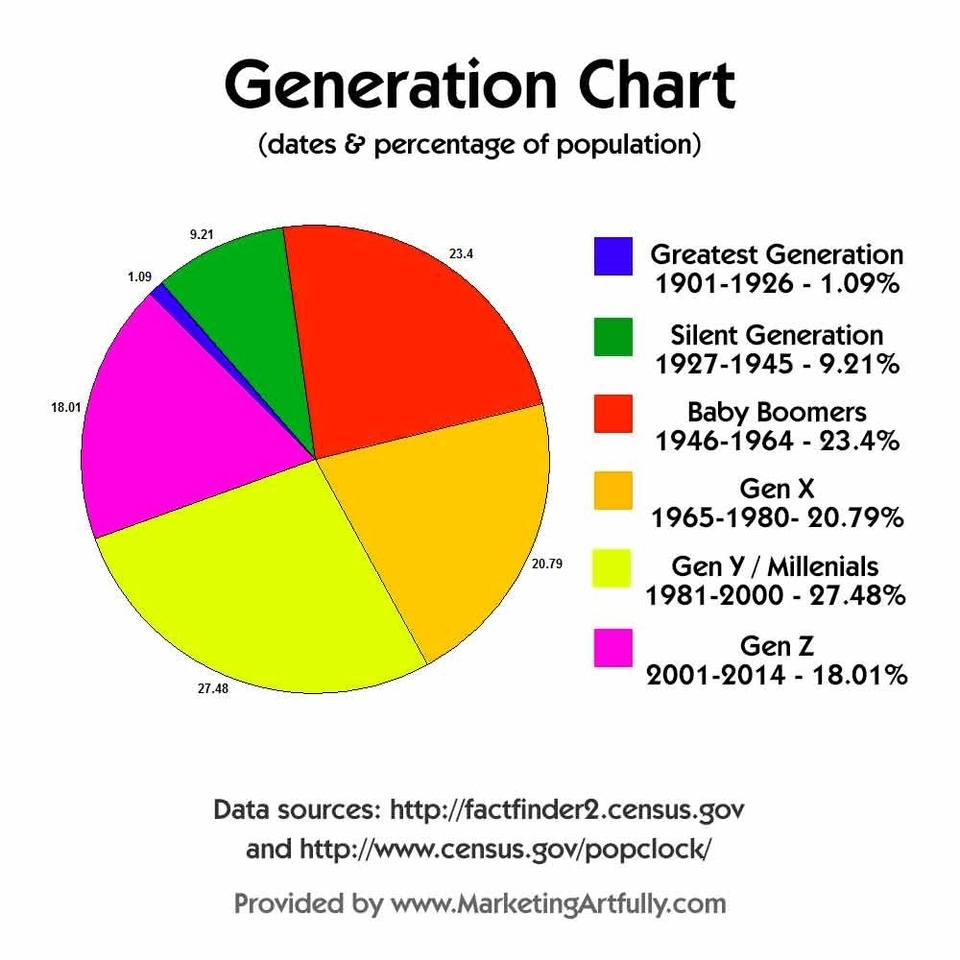
In the United States, the 2021 Census conducted by the US Census Bureau shows that the population is divided into the following generations:
| Generation | Birth Year | Age Range |
|—————-|—————-|—————|
| Generation Alpha | 2013 – present | 0 – 8 |
| Generation Z | 1997 – 2012 | 9 – 24 |
| Millennials | 1981 – 1996 | 25 – 40 |
| Generation X | 1965 – 1980 | 41 – 56 |
| Baby Boomers | 1946 – 1964
Science and Its Branches: Science is divided into various branches, including physical sciences (physics, chemistry), life sciences (biology, medicine), and social sciences (psychology, sociology). Each branch focuses on specific aspects of the natural world and human behavior, contributing to a comprehensive understanding of the universe.

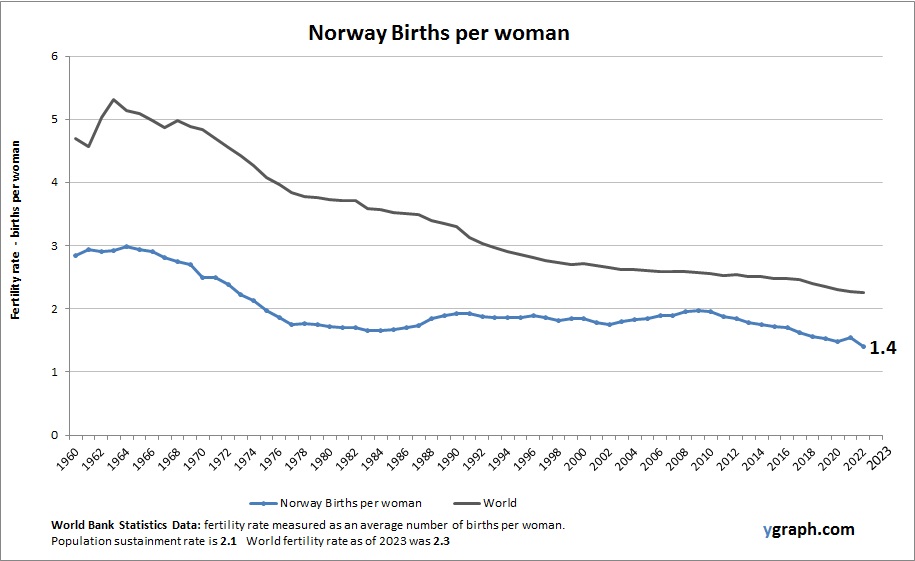
This diagram presents Norway Births per woman. This is according to World Bank birth stats by country. Based on the latest available information for Norway.
Norway has fertility rates close to replacement level, supported by extensive social welfare programs, parental leave policies, and gender equality initiatives. Population growth is steady, aided by immigration. Urbanization is high, and the aging population is balanced by strong healthcare and family support systems.