Population pie of British Columbia is a term that refers to the distribution of the population in the province by different ethnic groups, regions, and other characteristics. According to the 2021 census, British Columbia had a population of about 5 million people, making it the third most populous province in Canada after Ontario and Quebec. The population pie of British Columbia can be divided into several slices based on various criteria, such as:
– Ethnic origin: The largest ethnic group in British Columbia is European, accounting for about 60% of the population. Within this group, the most common origins are British, German, Irish, French, Scottish, and Ukrainian. The second largest ethnic group is Asian, representing about 30% of the population. The most common Asian origins are Chinese, Indian, Filipino, Korean, and Japanese. The third largest ethnic group is Aboriginal, comprising about 6% of the population. The most common Aboriginal identities are First Nations, Métis, and Inuit. The remaining 4% of the population belong to other ethnic groups, such as African, Latin American, Middle Eastern, and Oceania.
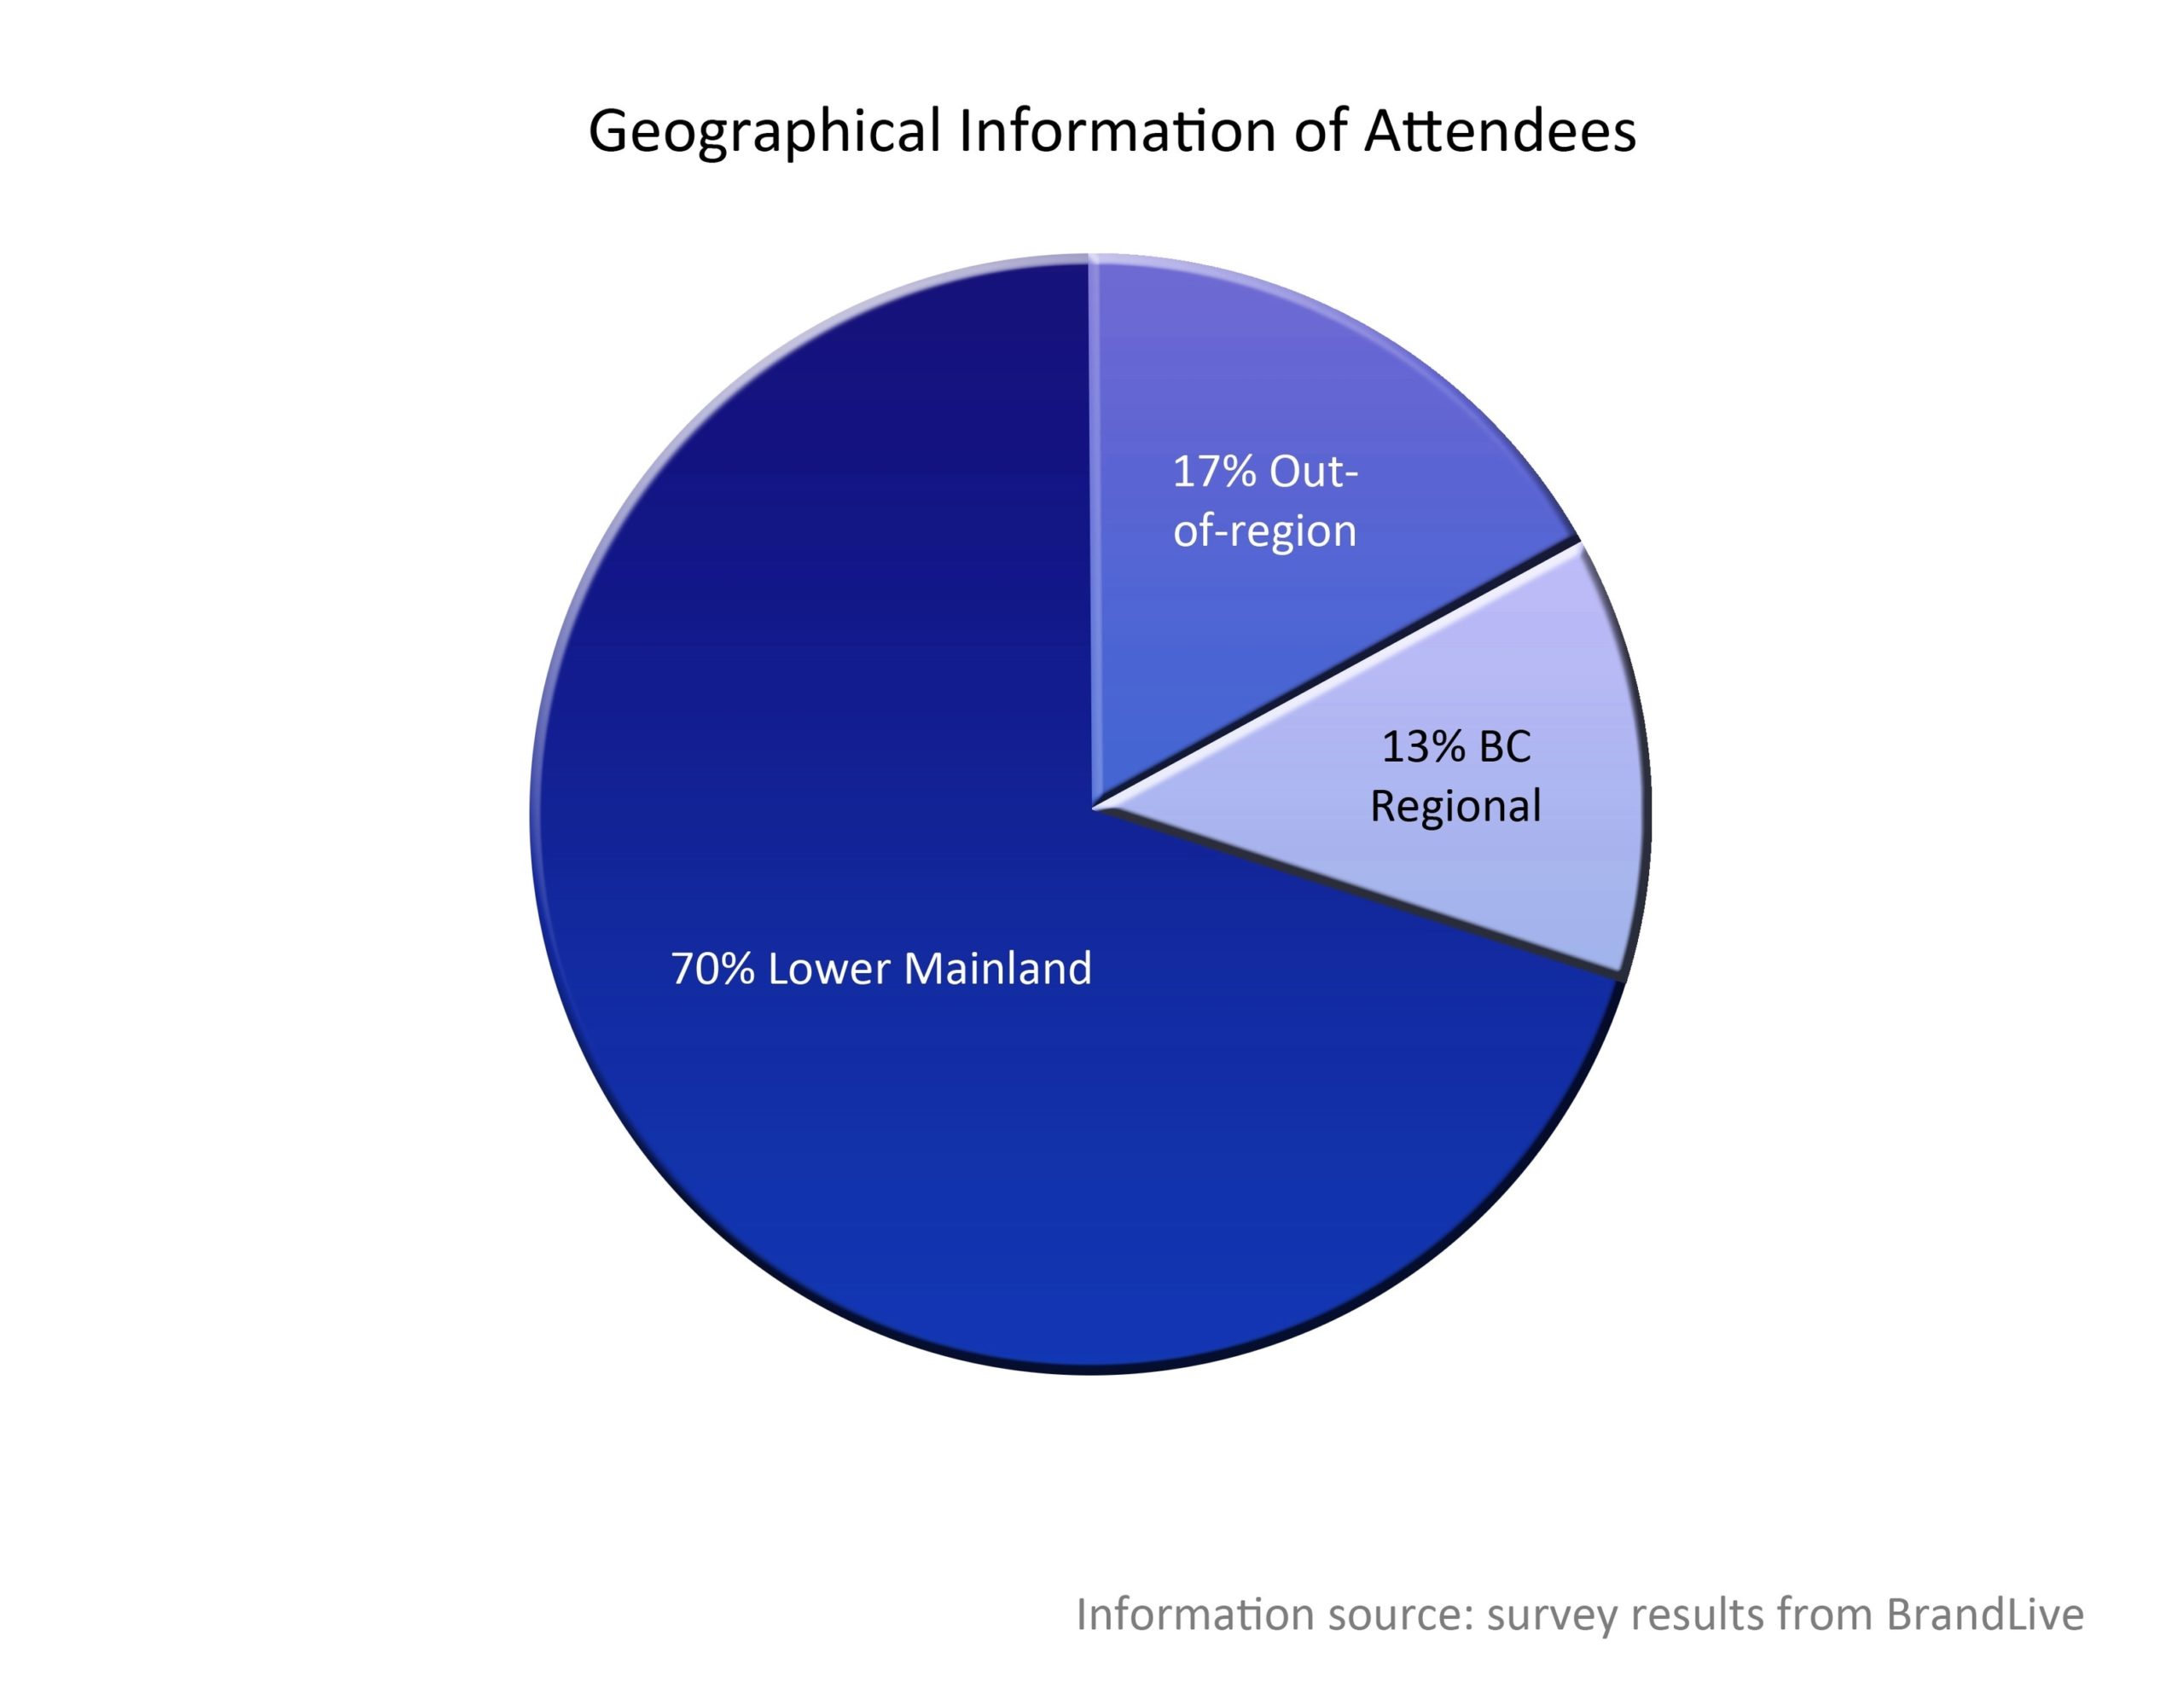
– Region: The population of British Columbia is unevenly distributed across the province, with most people living in the southwestern corner,