Finland Births per woman

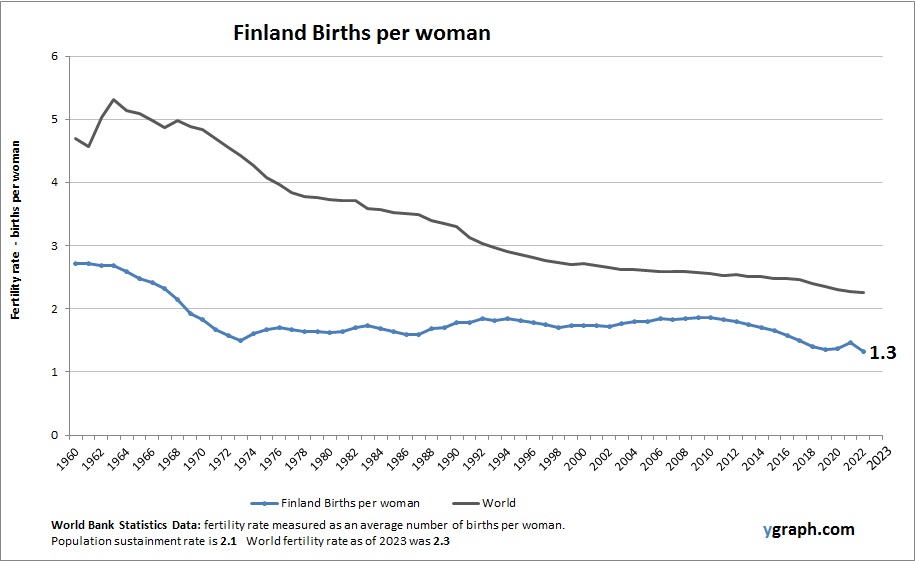
This diagram presents Finland Births per woman. The fertility rate statistics are compiled by World Bank. Latest births per woman information for Finland.

Finland’s fertility rate is below replacement level, contributing to an aging population. Government policies supporting work-life balance, parental leave, and childcare aim to encourage higher birth rates, but economic and social factors continue to limit population growth. Urbanization and high living standards characterize demographic trends.

Finland Births per woman

Portugal Births per woman

Chart above demonstrates Portugal Births per woman. World Bank is the source of this birth data. Latest births per woman information for Portugal.

Portugal has one of the lowest fertility rates in the European Union, contributing to an aging population and labor market pressures. Despite supportive family policies, economic factors and changing social values continue to limit family size.

Portugal Births per woman

Equatorial Guinea Births per woman

Chart above demonstrates Equatorial Guinea Births per woman. World Bank is the source of this birth data. Latest births per woman information for Equatorial Guinea.

Equatorial Guinea maintains a high fertility rate, supported by traditional family values and limited access to family planning in rural areas. Despite oil wealth, social development indicators remain low, affecting maternal health and education outcomes.

Equatorial Guinea Births per woman

Life Cycle Of A Ferns

Life Cycle Of A Ferns: The life cycle of ferns includes both asexual and sexual phases. It starts with the release of spores, which grow into a gametophyte. The gametophyte produces gametes that fuse to form a zygote, developing into a sporophyte. The sporophyte then produces spores, continuing the cycle.

Life Cycle Of A Ferns

Armenia Population

Chart above demonstrates Armenia Population. This is according to World Bank total population stats. Based on the latest available information for Armenia.

Armenia’s population is gradually declining due to low fertility rates and high levels of emigration. The demographic structure reflects an aging trend, with the government promoting incentives to reverse population decline and retain young professionals.

Armenia Population

Us Presidential Election Process

Us Presidential Election Process: The U.S. presidential election process involves primary elections, party conventions, and the general election. Candidates campaign to win delegates and electoral votes, with the winner needing a majority of the electoral votes.

Us Presidential Election Process

Plant Cell Diagram Explanation

Plant Cell Diagram Explanation: Plant cells have unique structures such as the cell wall, chloroplasts, and large central vacuole. The cell wall provides rigidity, chloroplasts enable photosynthesis, and the vacuole maintains turgor pressure. Diagrams often highlight these components to illustrate their functions.

Plant Cell Diagram Explanation

Latvia Population

This diagram presents Latvia Population. The country statistics are compiled by World Bank. Based on the latest demographics info provided for Latvia.

Latvia has a small population that has been declining due to low fertility rates and emigration, particularly of younger people seeking opportunities abroad. Urban centers remain hubs of population, while rural areas face decline and aging populations. Efforts to retain residents and attract immigrants are part of demographic strategies.

Latvia Population