Another life history diagram explaining the course of human history.

Charts, Graphs and Diagrams
Another life history diagram explaining the course of human history.
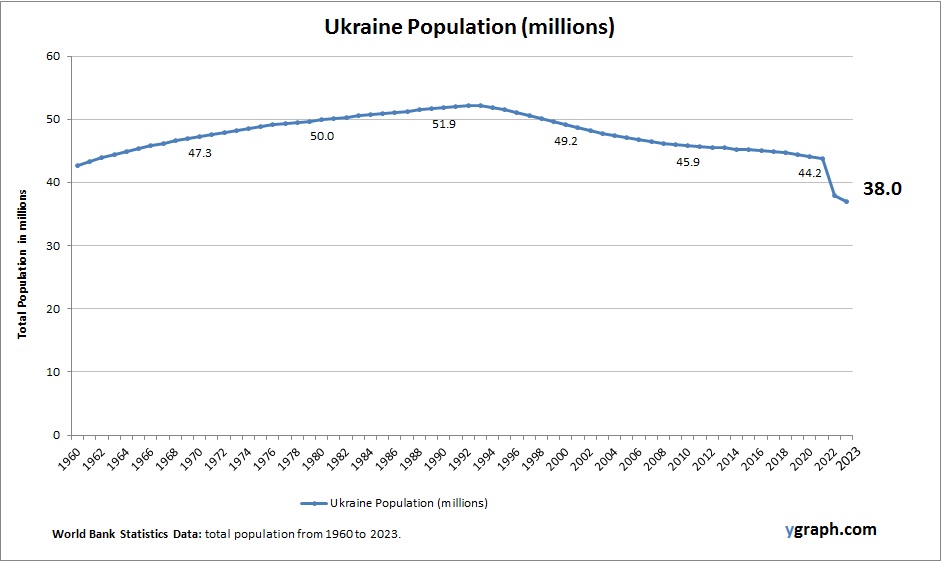
The above graph shows Ukraine Population. The country statistics are compiled by World Bank. Based on the latest available information for Ukraine.
Ukraines population has been shrinking due to low fertility, high mortality, and significant emigration, especially among younger cohorts. The war and ongoing economic instability have accelerated these trends. The population is aging rapidly, and the demographic outlook poses serious challenges for reconstruction, labor force planning, and healthcare systems.
The scientific method is a logical and systematic way of acquiring knowledge and testing hypotheses in science. It involves the following steps:
1. Observation: A scientist makes a careful and objective observation of a phenomenon or a problem in the natural world.
2. Question: Based on the observation, the scientist asks a question that can be answered by empirical evidence.
3. Hypothesis: The scientist proposes a possible explanation or answer to the question, based on existing knowledge or theories.
4. Prediction: The scientist deduces the logical consequences or implications of the hypothesis, and makes a testable prediction.
5. Experiment: The scientist designs and conducts an experiment or a study to test the prediction, and collects and analyzes the data.
6. Conclusion: The scientist evaluates the results of the experiment, and compares them with the prediction. The scientist then accepts, rejects, or modifies the hypothesis, and reports the findings and the evidence.
The scientific method is not a rigid or fixed procedure, but rather a flexible and iterative process that can vary depending on the field of study, the topic of investigation, and the specific research question. The scientific method also involves peer review, replication, and communication of the results, which help to ensure the validity, reliability, and objectivity of scientific knowledge.
Here is an example of how the scientific method can be applied to a practical problem:
– Observation: You notice that your bread does not toast when you put it in the toaster and press the button.
– Question: Why does your bread not toast?
– Hypothesis: You suspect that the electrical outlet is broken, and that the toaster is not getting any power.
– Prediction: You predict that if you plug the toaster into a different outlet, it will toast your bread.
– Experiment: You plug the toaster into another outlet in the kitchen, and try to toast your bread again.
– Conclusion: You observe that the toaster works in the other outlet, and your bread gets toasted. You conclude that your hypothesis was correct, and that the original outlet was broken.
The scientific method is a powerful tool for advancing scientific knowledge and solving problems in various domains of science, such as biology, chemistry, physics, psychology, and more. By using the scientific method, scientists can make observations, ask questions, formulate hypotheses, make predictions, test hypotheses, draw conclusions, and communicate their findings in a rigorous and logical manner. .
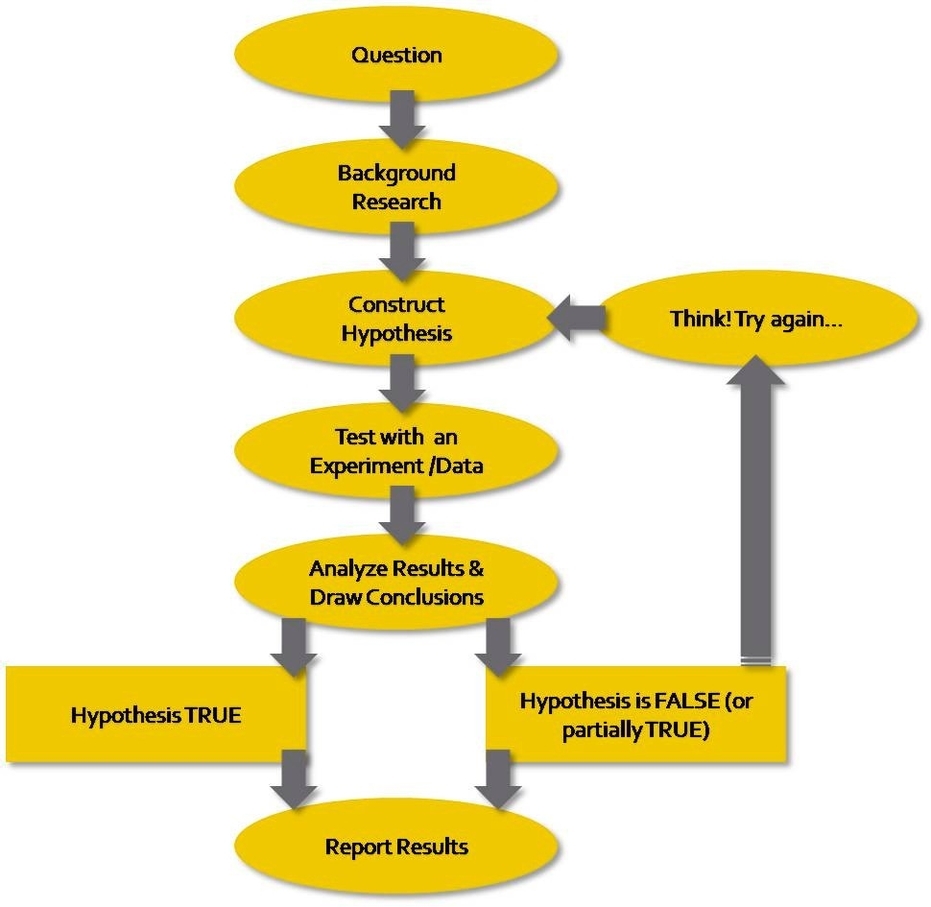
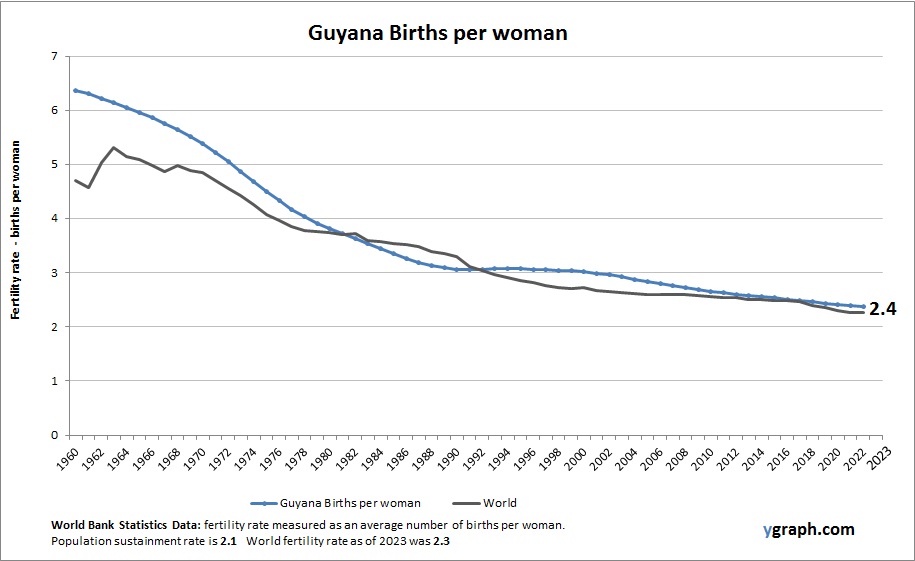
Chart above demonstrates Guyana Births per woman. This is according to World Bank birth stats by country. Based on the latest demographics info provided for Guyana.
Guyanas fertility rate has been gradually declining as urbanization increases and education improves, although rural areas maintain higher birth rates. The countrys ethnically diverse population experiences varying demographic patterns, with migration also influencing population size and structure. Economic challenges and development initiatives affect reproductive health access.
Us Government Branches: The U.S. government is divided into three branches

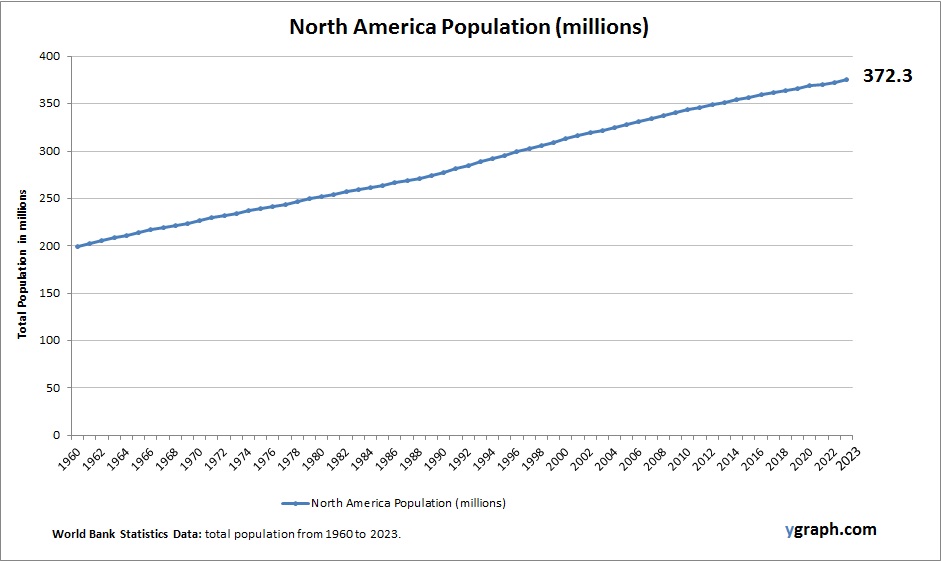
This diagram presents North America Population. The country statistics are compiled by World Bank. Latest population information for North America.
North Americas population is diverse and steadily increasing, driven by relatively higher fertility rates in some areas and strong immigration flows. The demographic structure varies widely, from aging populations in Canada to younger, growing populations in parts of the United States and Mexico.
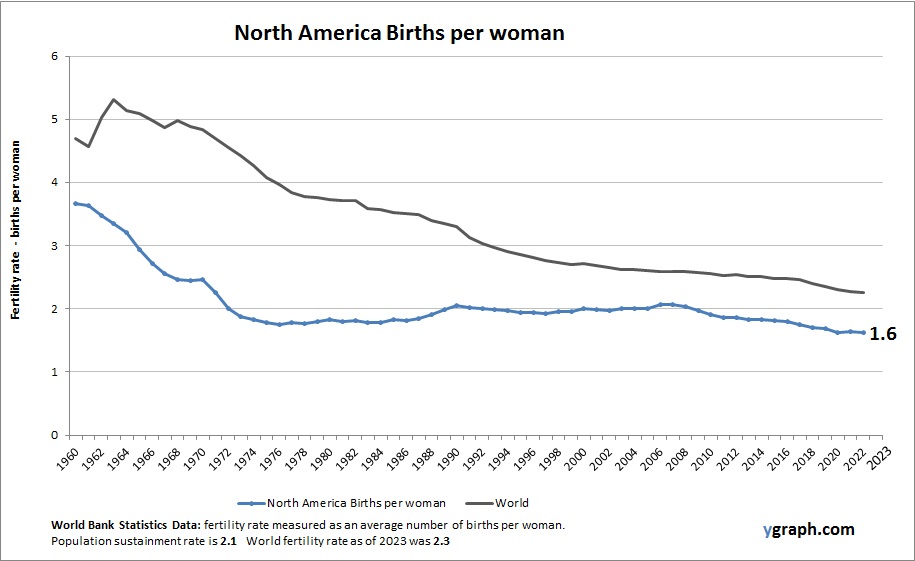
This diagram presents North America Births per woman. This is according to World Bank birth stats by country. Latest births per woman information for North America.
North America experiences moderate fertility rates overall, with significant variation among different ethnic and socioeconomic groups. Factors such as urbanization, education, healthcare access, and cultural diversity influence birth rates. Immigration sustains population growth, while many native-born populations exhibit below-replacement fertility. Demographic trends shape policy debates around healthcare, education, and workforce development.
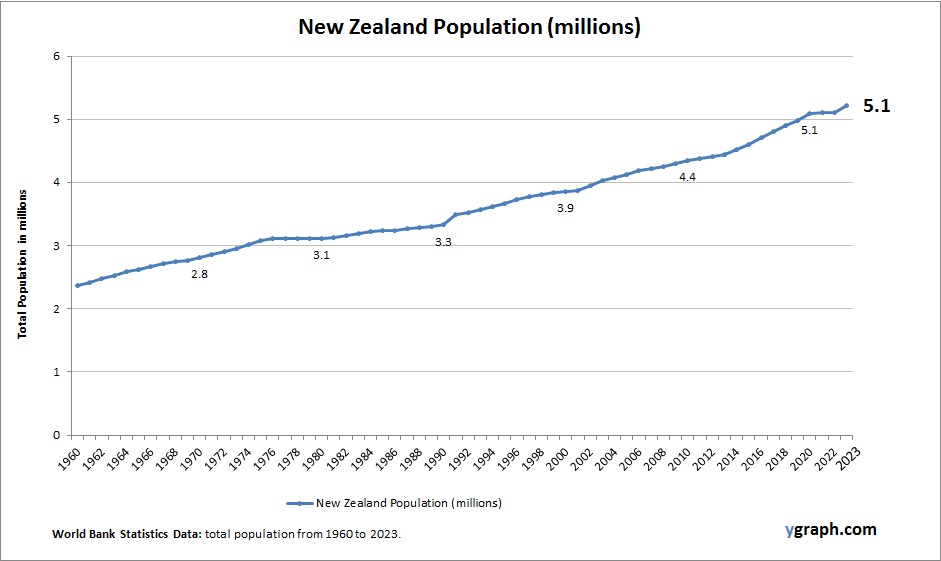
The above graph shows New Zealand Population. This is according to World Bank total population stats. Latest population information for New Zealand.
New Zealand’s population continues to grow, largely supported by immigration, as fertility rates have declined below replacement level. The countrys demographic profile reflects an aging population, with strong multicultural influences shaping societal and economic development.
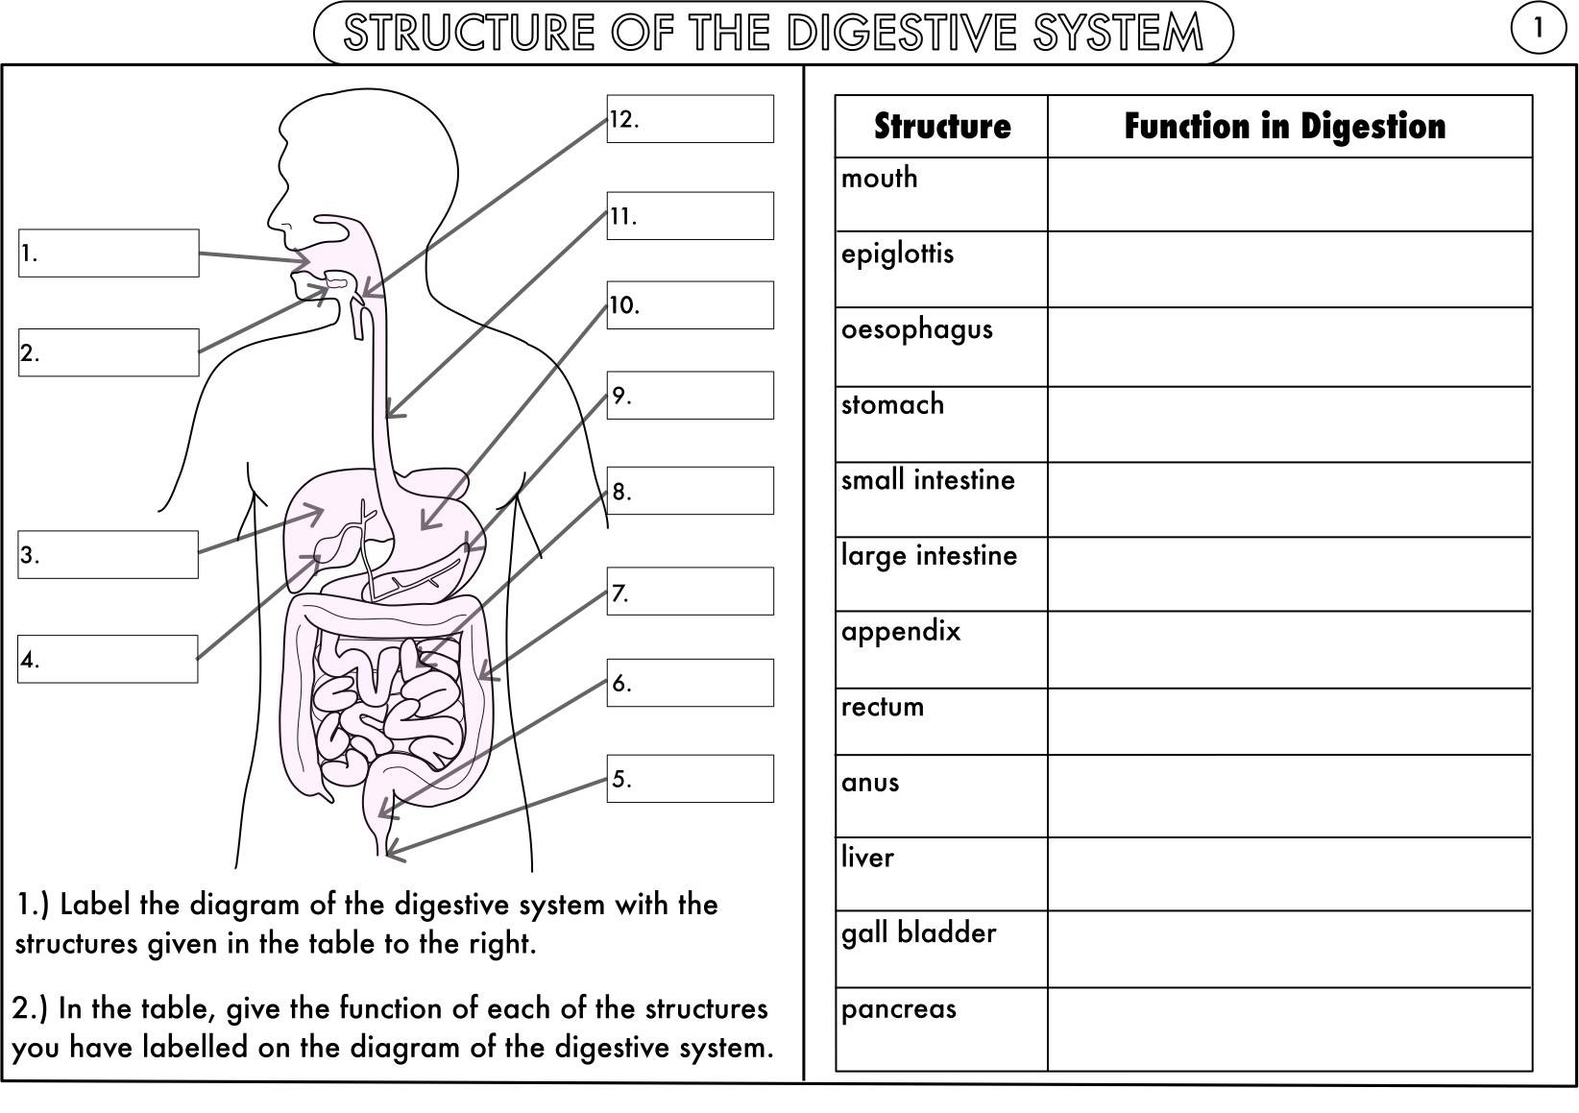
Gcse Biology Worksheet Pack: A GCSE biology worksheet pack includes various worksheets covering topics like cell biology, genetics, ecology, and human physiology. These worksheets provide exercises and questions to help students prepare for their GCSE biology exams.
Left Right Political Spectrum: The left-right political spectrum categorizes political ideologies based on their economic and social policies. Left-wing ideologies support social equality and government intervention, while right-wing ideologies emphasize individual liberty and free-market principles.