Cognitive

Cognitive: Cognitive refers to the mental processes involved in gaining knowledge and comprehension, including thinking, knowing, remembering, judging, and problem-solving. These are higher-level functions of the brain and encompass language, imagination, perception, and planning.

Cognitive

Europe & Central Asia (excluding high income) Population

Chart above demonstrates Europe & Central Asia (excluding high income) Population. The country statistics are compiled by World Bank. Based on the latest demographics info provided for Europe & Central Asia (excluding high income).

This region faces mixed population trends—some countries are aging and shrinking, while others still experience moderate growth. Urbanization, migration, and fertility declines define regional demographic shifts, prompting policy adjustments for sustainable development.

Europe & Central Asia (excluding high income) Population

Middle East & North Africa (IDA & IBRD countries) Population

This diagram presents Middle East & North Africa (IDA & IBRD countries) Population. The country statistics are compiled by World Bank. Based on the latest demographics info provided for Middle East & North Africa (IDA & IBRD countries).

The population of Middle East and North Africa countries classified as IDA and IBRD reflects a young demographic with high fertility rates relative to global averages. Rapid urbanization, economic diversification, and improvements in healthcare are shaping demographic transitions, but population growth continues to challenge resource allocation and development efforts.

Middle East & North Africa (IDA & IBRD countries) Population

Timeline Flow Chart Example

A Timeline Flow Chart Example is a visual representation that organizes events, milestones, or processes in chronological order, often using arrows or linear connections to show the progression over time. This type of chart is particularly effective for illustrating historical developments, project schedules, business growth, product launches, or policy changes in a way that is easy to follow and understand. Each point on the timeline typically includes a date or time reference alongside a brief description of the event, allowing viewers to grasp both the sequence and significance of each step. Unlike traditional timelines, which might simply place events on a straight line, a timeline flow chart integrates directional flow and sometimes branching paths, making it useful for showing dependencies, cause-and-effect relationships, or decision points within a process. For example, in an economics or GDP context, a timeline flow chart might trace the major financial reforms, economic crises, or growth spurts of a country over decades, linking them to changes in policy or global events. This layered structure not only helps highlight the progression but also clarifies how one stage leads to the next. As a tool, a timeline flow chart is versatile, intuitive, and ideal for presentations, reports, or educational content where clarity and sequence are critical.ow it can help you!.

Timeline Flow Chart 89

Gcse Biology Aqa Genetic Diagrams Worksheet

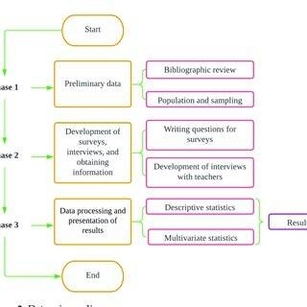
Data Science Life Cycle: The data science life cycle involves stages such as data collection, data cleaning, data analysis, model building, and deployment. Each stage is crucial for transforming raw data into actionable insights and making data-driven decisions.

Gcse Biology Aqa Genetic Diagrams Worksheet

Quantum Physics Diagram

Quantum Physics Diagram: A quantum physics diagram depicts concepts such as wave-particle duality, quantum entanglement, and superposition. These diagrams help visualize the abstract and complex principles of quantum mechanics, making them more accessible to learners.

Quantum Physics Diagram

Parts Of The Brain

Parts Of The Brain: The brain is divided into several key parts, including the cerebrum, cerebellum, and brainstem. Each part has specific functions, such as the cerebrum controlling voluntary actions and cognitive functions, the cerebellum managing balance and coordination, and the brainstem regulating vital involuntary processes.

Parts Of The Brain

Sweden Population

Chart above demonstrates Sweden Population. This is according to World Bank total population stats. Based on the latest demographics info provided for Sweden.

Sweden has a stable population with fertility rates close to replacement level, supported by comprehensive social policies such as generous parental leave and childcare support. Immigration contributes significantly to population growth, and urban areas continue to expand. The country’s demographic trends reflect a balance between aging and renewal.

Sweden Population

Guatemala Births per woman

The above graph shows Guatemala Births per woman. World Bank is the source of this birth data. Based on the latest demographics info provided for Guatemala.

Guatemala maintains relatively high fertility rates driven by cultural norms and limited access to family planning in rural areas. Urbanization and education are gradually contributing to fertility declines. Population growth remains strong, with a youthful demographic shaping social and economic needs.

Guatemala Births per woman

Bangladesh Births per woman

This diagram presents Bangladesh Births per woman. The fertility rate statistics are compiled by World Bank. Based on the latest demographics info provided for Bangladesh.

Bangladesh has seen a dramatic decline in fertility over the past decades, thanks to strong family planning programs, education, and healthcare access. While rural areas still have higher fertility, national trends reflect continued movement toward replacement-level birth rates.

Bangladesh Births per woman