Belize Population

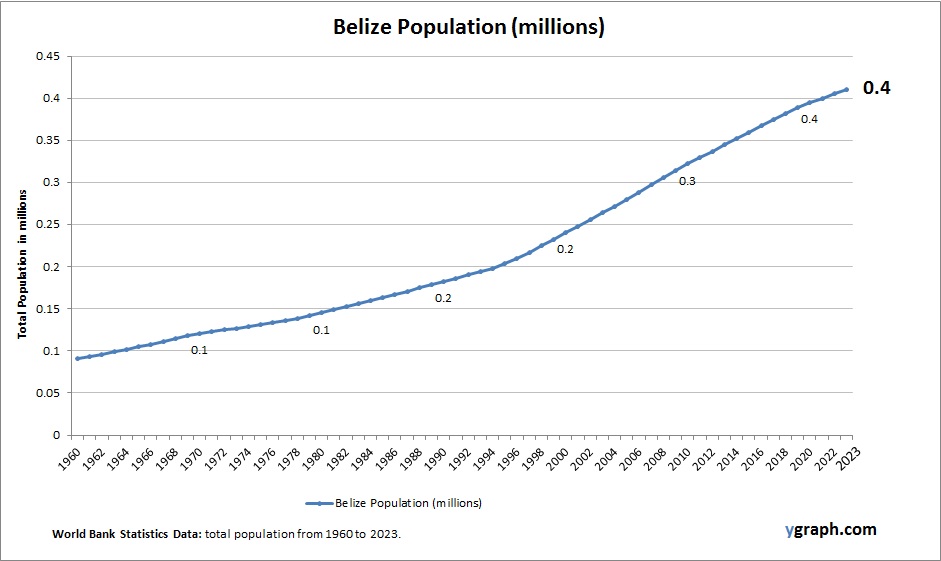
This diagram presents Belize Population. This is according to World Bank total population stats. Based on the latest demographics info provided for Belize.

Belize’s population is small but growing at a moderate pace. Urbanization, youth migration, and a relatively high birth rate shape the country’s demographic profile, with a young population structure and increasing access to healthcare and education.

Belize Population

Economics Diagrameconomic Flow Diagram

The term economic flow refers to the movement of goods, services, and money within an economy. It is a fundamental concept in economics that helps us understand how different sectors of the economy interact with each other. There are two main models that economists use to explain economic flow: the circular flow model and the economic cycle.

The circular flow model is a simplified representation of how money and goods move between households and businesses. In this model, households provide labor to businesses in exchange for wages, which they use to purchase goods and services from businesses. Businesses, in turn, use the revenue generated from these sales to pay for labor and other inputs. This creates a circular flow of money and goods between households and businesses, which is essential for the functioning of a market economy .

The economic cycle, also known as the business cycle, refers to the fluctuations in economic activity that occur over time. The cycle is characterized by four stages: expansion, peak, contraction, and trough. During the expansion phase, the economy grows rapidly, with low unemployment rates and high levels of consumer spending. The peak phase marks the end of the expansion and the beginning of a contraction, during which economic activity slows down, unemployment rates rise, and consumer spending decreases. The trough phase is the bottom of the cycle, where the economy is at its weakest. Finally, the cycle enters the expansion phase again, and the process repeats itself .

The economic cycle is driven by a variety of factors, including changes in interest rates, government policies, and technological innovations. Understanding the economic cycle is important for investors and businesses, as it can help them make informed decisions about when to invest and when to pull back. It is also important for policymakers, who can use fiscal and monetary policies to stabilize the economy during times of contraction .

In conclusion, the concept of economic flow is essential for understanding how different sectors of the economy interact with each other. The circular flow model and the economic cycle are two important models that economists use to explain economic flow. By understanding these models, we can gain a better understanding of how the economy works and make informed decisions about our investments and policies.

Economics Diagrameconomic Flow Diagram

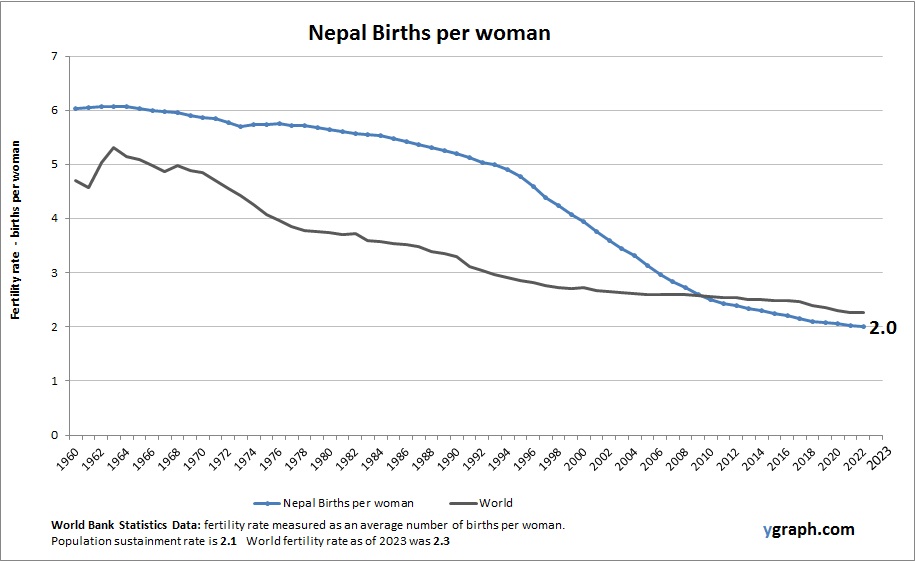
Nepal Births per woman

Chart above demonstrates Nepal Births per woman. The fertility rate statistics are compiled by World Bank. Latest births per woman information for Nepal.

Nepal has experienced a significant decline in fertility rates over recent decades due to increased education, healthcare access, and urbanization. Despite this, birth rates remain moderately high compared to global averages. Population growth continues, influenced by rural-urban migration and development efforts.

Nepal Births per woman

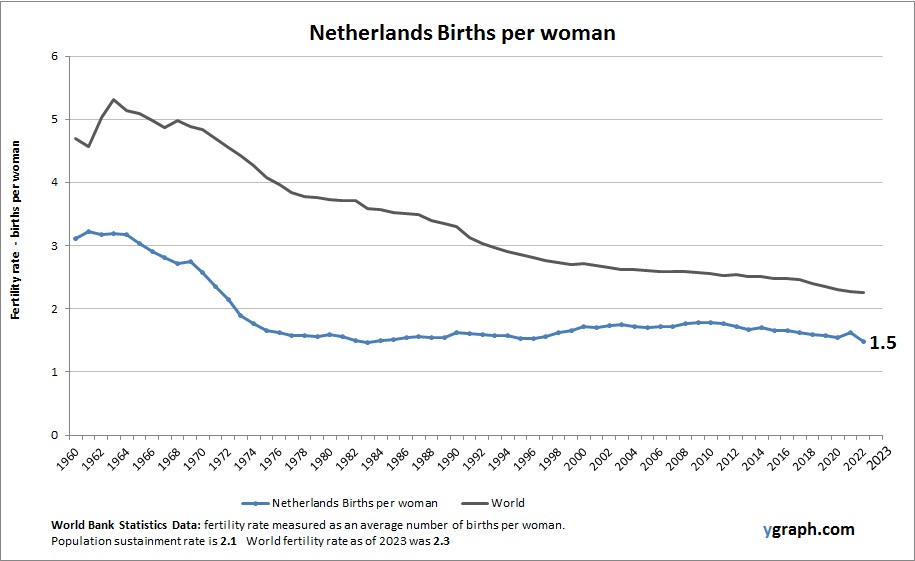
Netherlands Births per woman

Chart above demonstrates Netherlands Births per woman. This is according to World Bank birth stats by country. Based on the latest demographics info provided for Netherlands.

The Netherlands experiences low fertility rates, typical of Western European countries, influenced by factors such as delayed childbearing, high female labor participation, and widespread access to contraception. Although birth rates hover below replacement level, immigration helps sustain population size. Policies supporting work-life balance and family welfare contribute to demographic stability.

Netherlands Births per woman

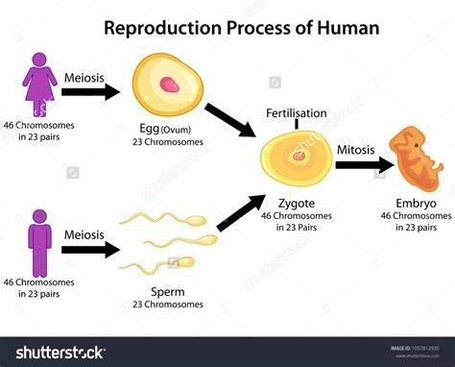
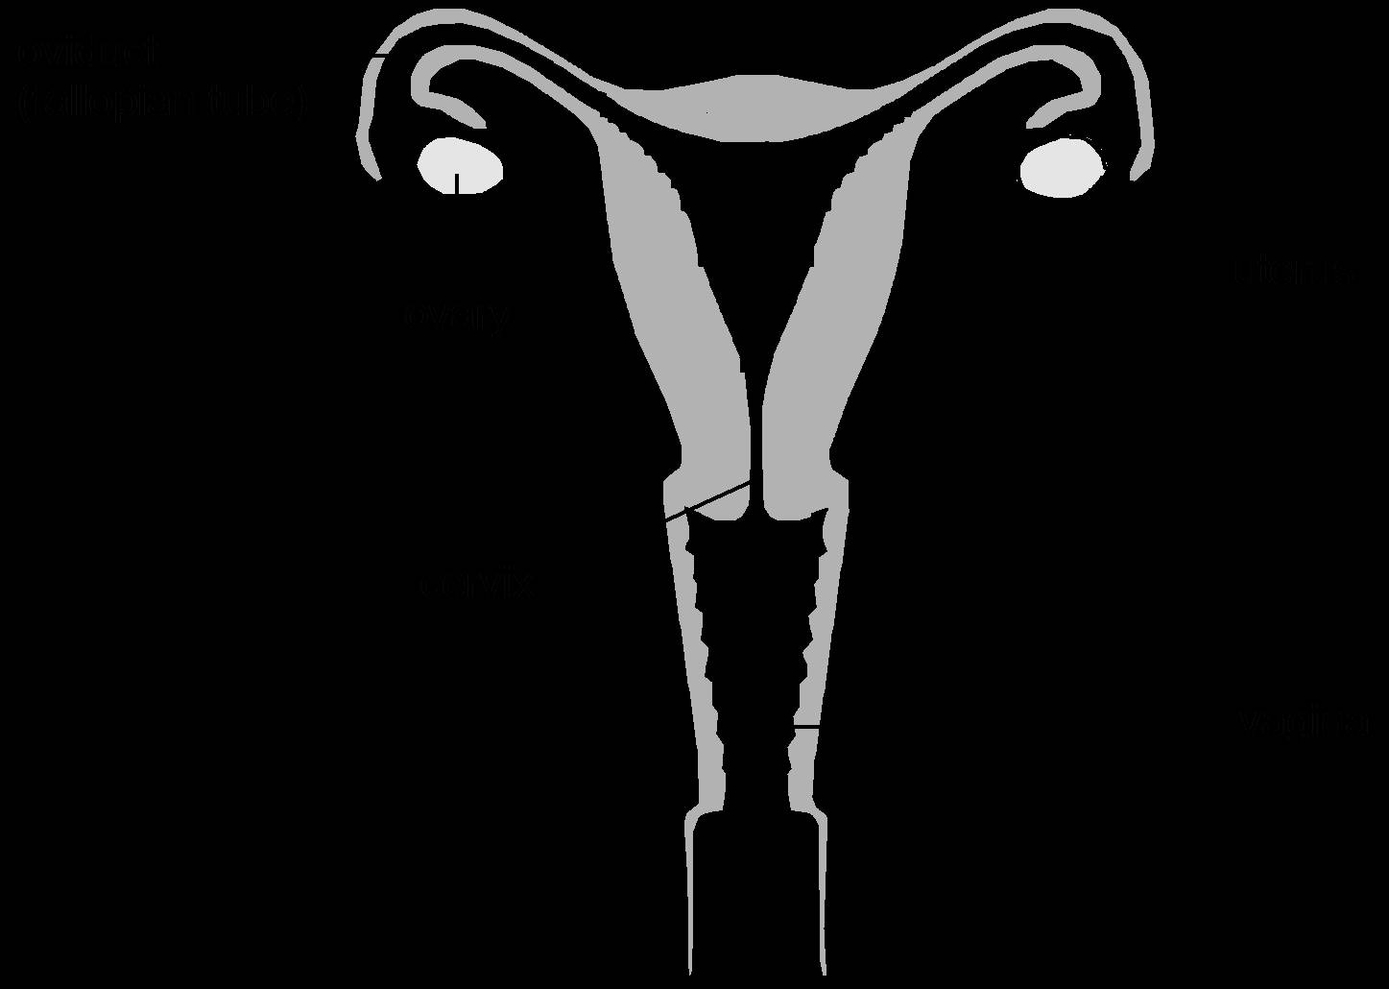
Human Reproduction Diagram

Human Reproduction Diagram: A human reproduction diagram displays the male and female reproductive systems, labeled with structures such as the testes, vas deferens, penis, ovaries, fallopian tubes, uterus, and vagina. Additional diagrams may show fertilization, embryo development, and menstrual cycle phases. These illustrations help explain the complex biological process of reproduction, from gamete formation to childbirth, and are fundamental in health education and biology curricula.

Books Th

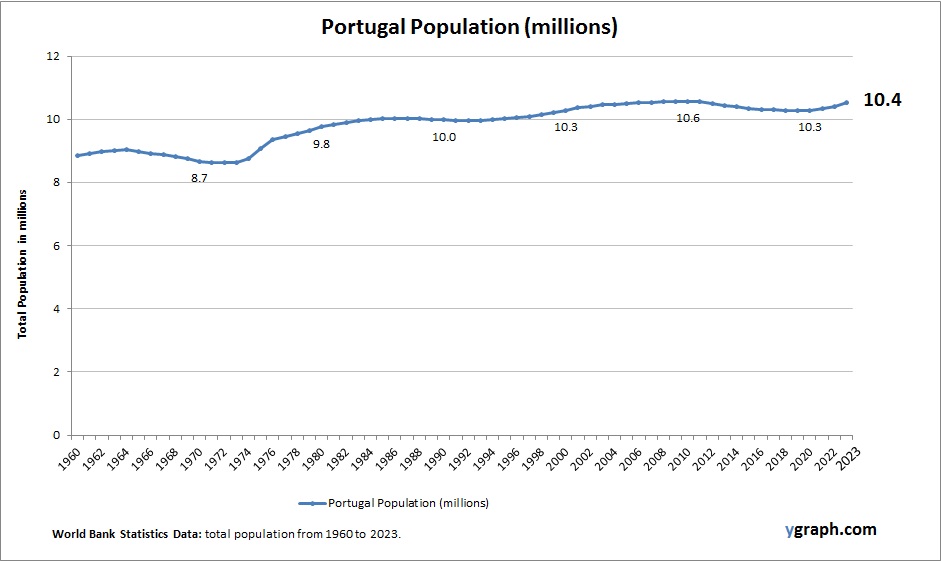
Portugal Population

The above graph shows Portugal Population. World Bank is the source of this population data. Based on the latest available information for Portugal.

Portugal’s population is stable or slowly declining due to low fertility rates and emigration. Urban centers such as Lisbon and Porto attract residents, while rural areas face depopulation and aging demographics. Government initiatives seek to encourage family growth and immigration to support demographic balance.

Portugal Population

Gravity Explanation Diagram With Formula Physics Gravitation Concept Map

Gravity Explanation Diagram With Formula Physics Gravitation Concept Map: A gravity explanation diagram with formulas and a concept map illustrates the principles of gravitational force. It includes key formulas, such as Newton’s law of gravitation, and visual representations of gravitational interactions.

Gravity Explanation Diagram With Formula Physics Gravitation Concept Map

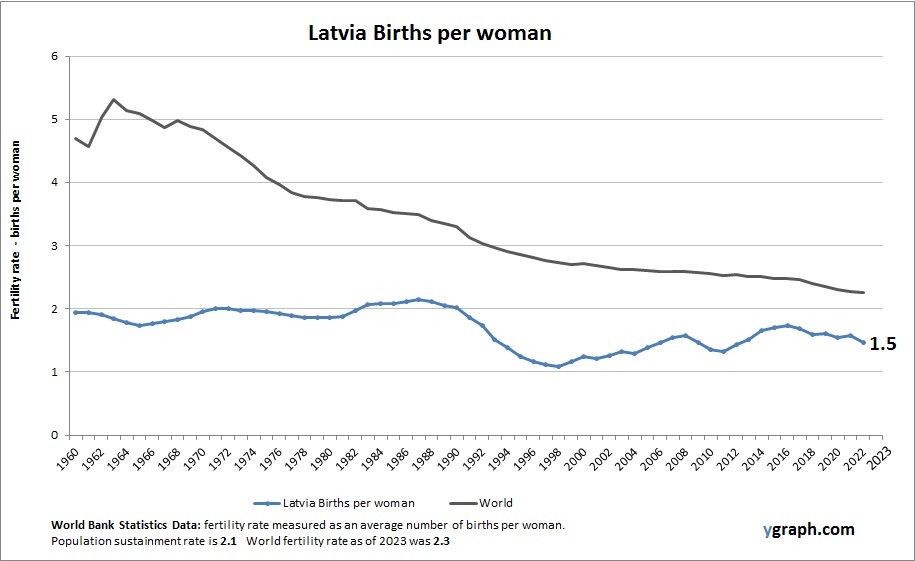
Latvia Births per woman

Chart above demonstrates Latvia Births per woman. World Bank is the source of this birth data. Latest births per woman information for Latvia.

Latvia’s fertility rate remains low, consistent with many Eastern European countries. Economic uncertainty, migration, and changing social norms have led to delayed childbearing and smaller families, contributing to population decline and aging.

Latvia Births per woman

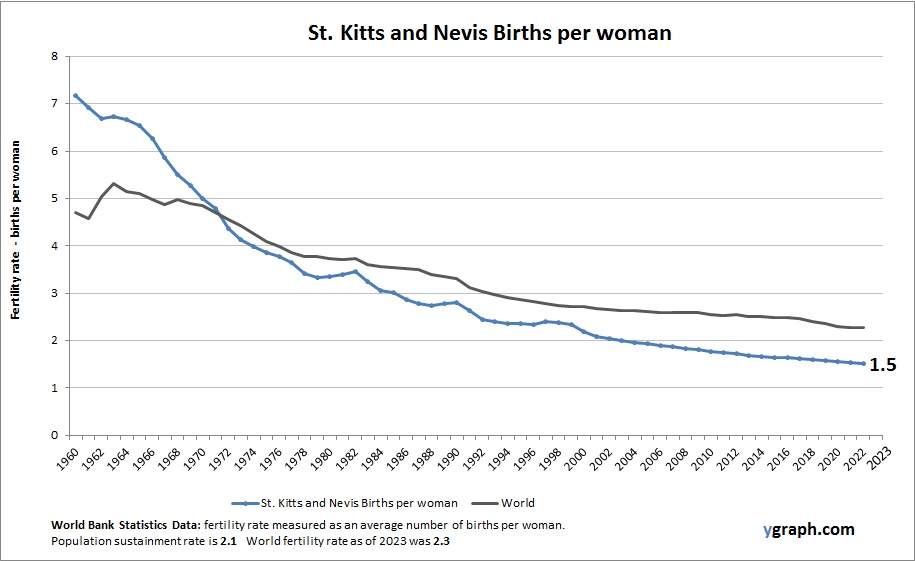
St. Kitts and Nevis Births per woman

Chart above demonstrates St. Kitts and Nevis Births per woman. The fertility rate statistics are compiled by World Bank. Based on the latest demographics info provided for St. Kitts and Nevis.

St. Kitts and Nevis has moderate fertility rates, reflecting trends common in small Caribbean nations where urbanization, education, and access to healthcare have gradually reduced family sizes. While birth rates have declined compared to previous decades, cultural values and economic factors still influence demographic patterns. The population growth remains modest, supported by relatively stable social and economic conditions.

St. Kitts and Nevis Births per woman