A permaculture design map is a visual representation of the layout and features of a site that follows the principles and ethics of permaculture. Permaculture is a system of designing agricultural landscapes that are ecologically sound, productive, and resilient. Permaculture design maps help to plan and implement strategies that work with nature, rather than against it, to create sustainable and harmonious environments.
There are different types of permaculture design maps, depending on the purpose and scale of the project. Some of the common ones are:
– The base map: This is a scale drawing that shows the basic, permanent features of the site, such as buildings, roads, fences, water sources, slopes, soil types, etc. The base map is the foundation for all the other maps, and can be created using aerial photos, satellite images, or field measurements.
– The sun map: This is a map that shows the sun exposure and shading patterns of the site throughout the year. The sun map helps to identify the best locations for plants, animals, and structures that require different levels of sunlight and heat. The sun map can be created using online tools, such as [SunCalc], or by observing and recording the sun’s position and shadows at different times of the day and year.
– The sector map: This is a map that shows the external influences and energies that affect the site, such as wind, fire, noise, pollution, wildlife, etc. The sector map helps to design strategies that either block, deflect, or harness these energies, depending on the desired outcome. For example, windbreaks can be planted to reduce wind erosion, or solar panels can be installed to capture solar energy.
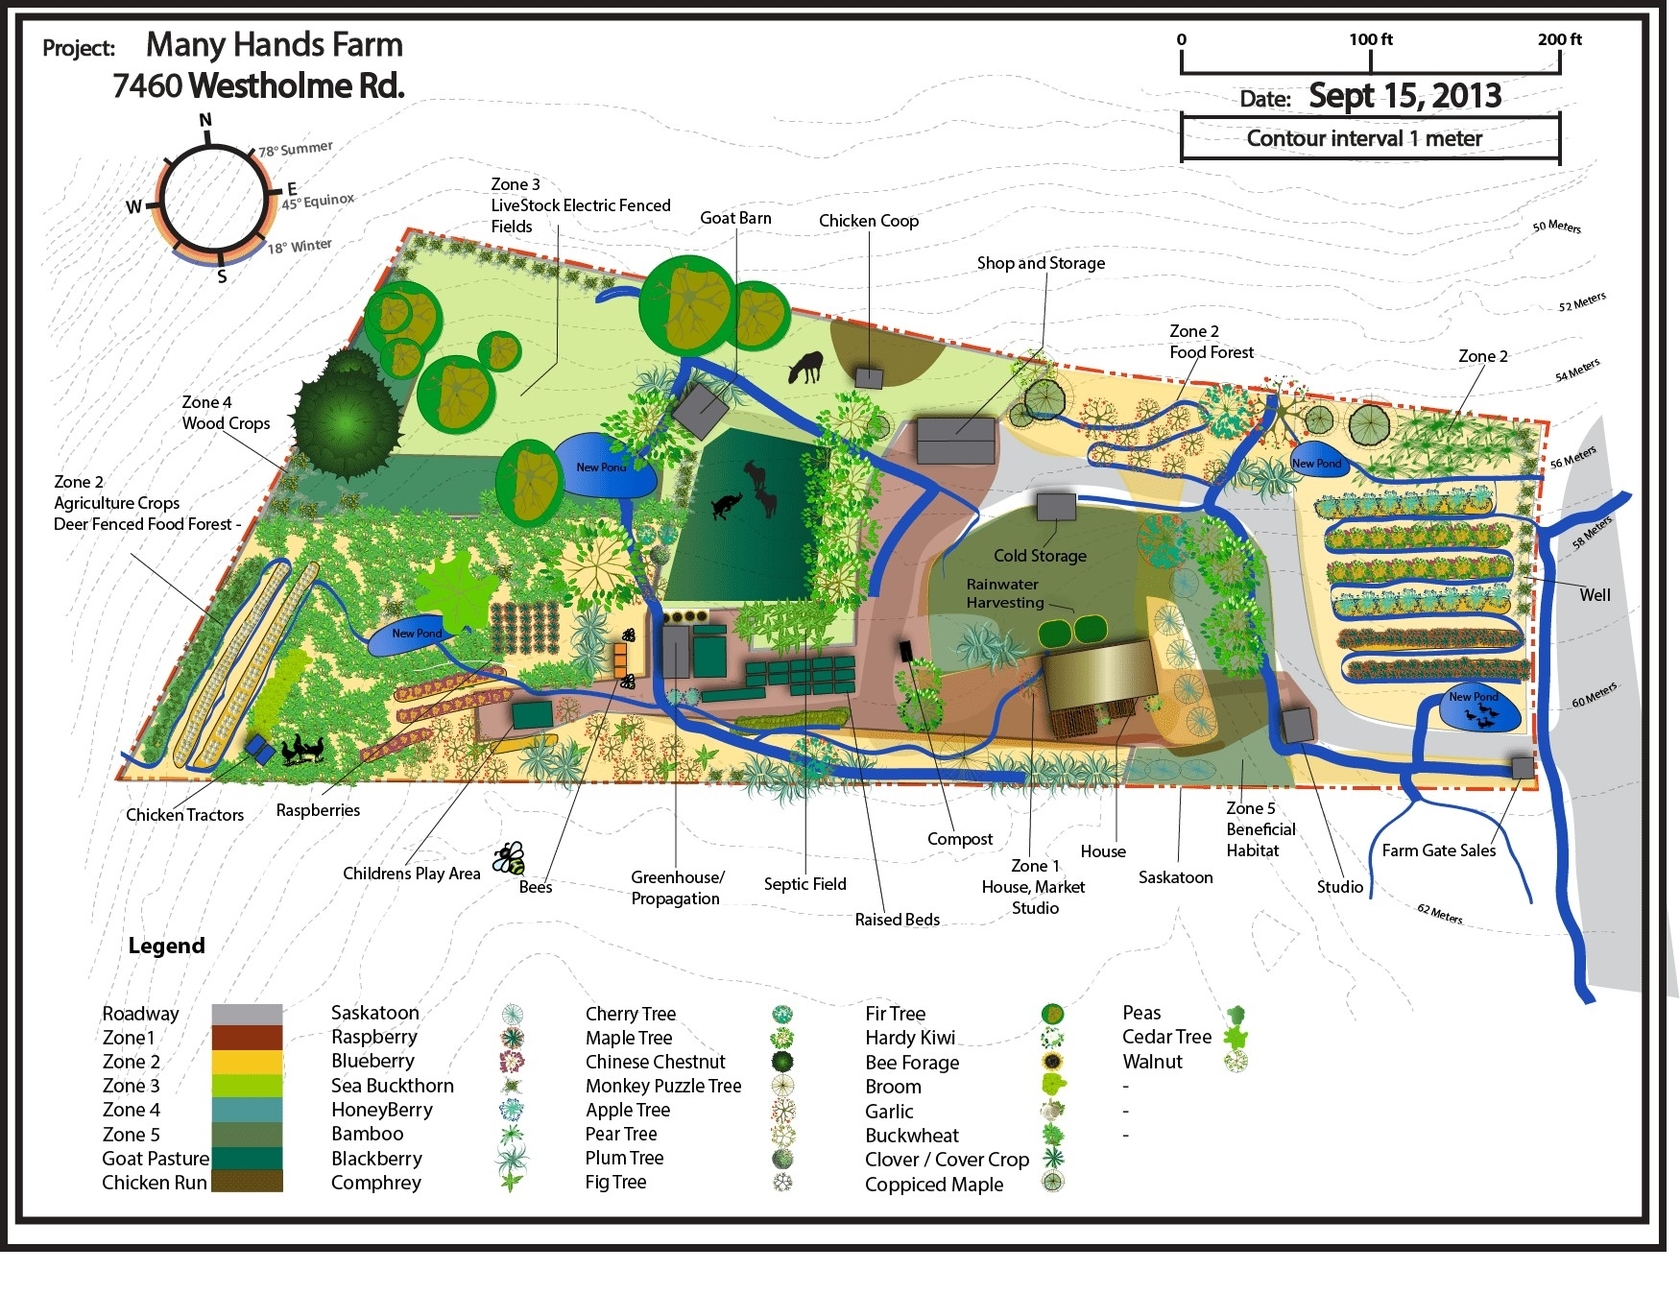
– The zone map: This is a map that shows the zones of use and activity on the site, based on the frequency and intensity of human interaction. The zone map helps to arrange the elements and features of the site in a way that optimizes efficiency, convenience, and productivity. The zones are usually numbered from 0 to 5, with 0 being the most frequently visited and 5 being the least. For example, zone 0 could be the house, zone 1 could be the kitchen garden, zone 2 could be the orchard, zone 3 could be the pasture, zone 4 could be the woodland, and zone 5 could be the wilderness.
– The master plan: This is a map that shows the final design of the site,