Combined probability is a concept in probability theory that deals with the likelihood of two or more events occurring together. It is used to calculate the probability of the intersection of two or more events. The probability of an event is a number between 0 and 1, where 0 means that the event is impossible and 1 means that the event is certain. The probability of the intersection of two or more events is the probability that all of the events will occur together.
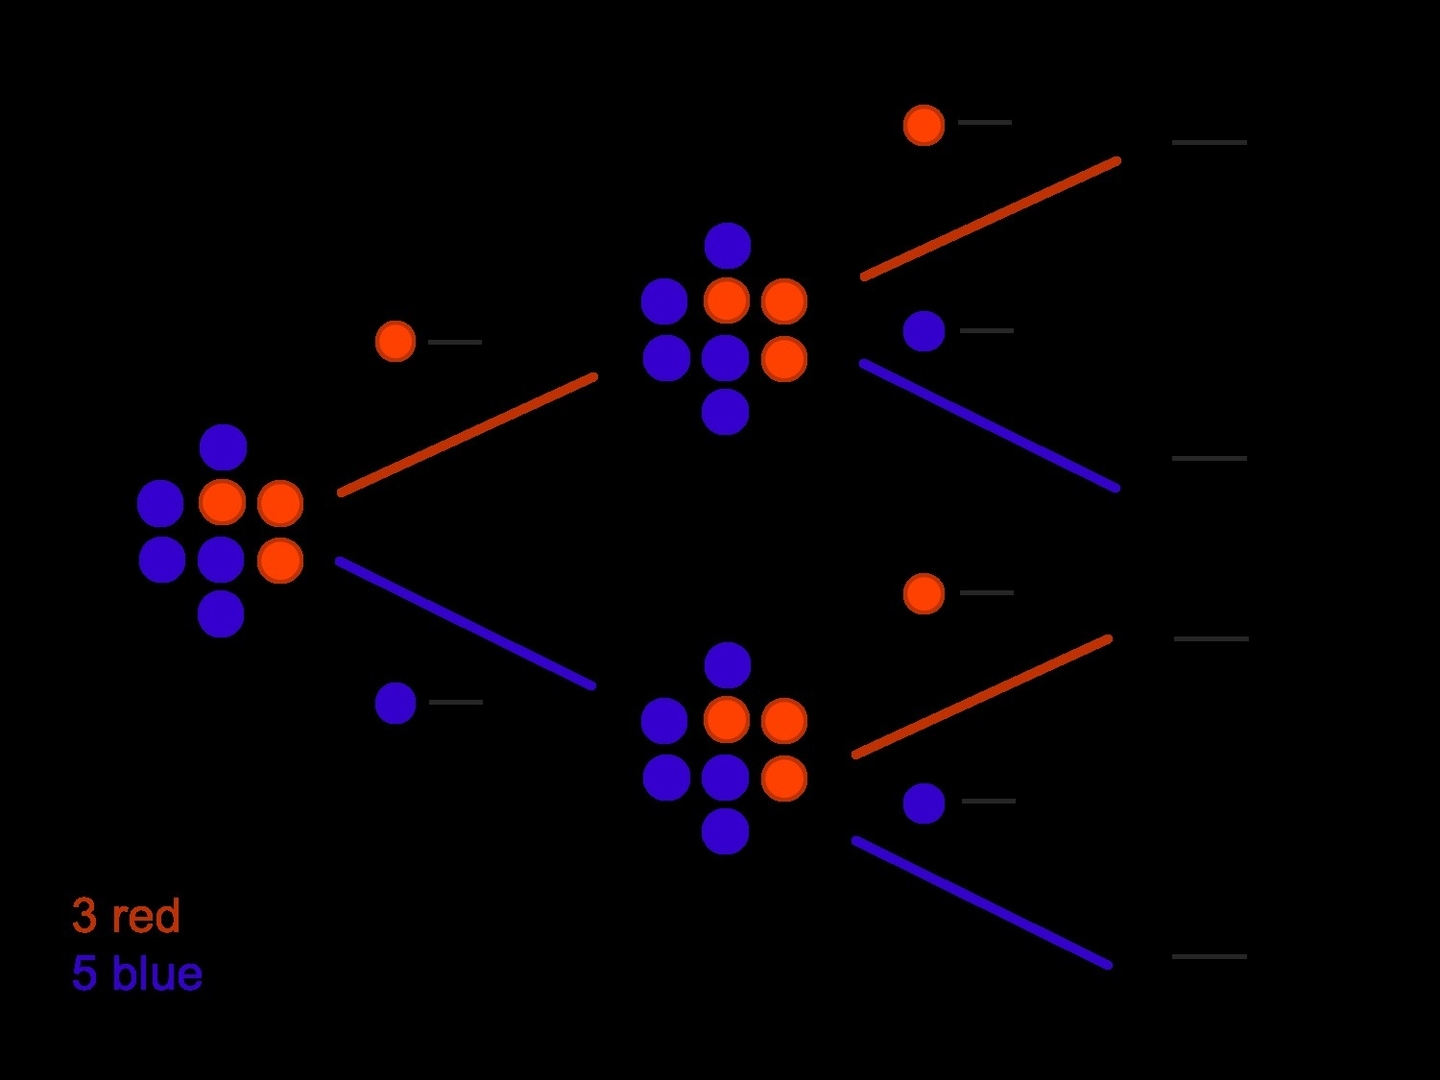
There are two types of events in probability theory: independent events and dependent events. Independent events are events that do not affect each other. For example, if you flip a coin and roll a die, the outcome of the coin flip does not affect the outcome of the die roll. Dependent events are events that do affect each other. For example, if you draw a card from a deck and then draw another card from the same deck without replacing the first card, the outcome of the second draw depends on the outcome of the first draw.
When two events are independent, the probability of both events occurring together is the product of their individual probabilities. For example, if you flip a coin and roll a die, the probability of getting heads on the coin and a 6 on the die is 1/2 * 1/6 = 1/12. When two events are dependent, the probability of both events occurring together is the product of the probability of the first event and the conditional probability of the second event given that the first event has occurred. For example, if you draw a card from a deck and then draw another card from the same deck without replacing the first card, the probability of drawing a spade and then a heart is (13/52) * (13/51).
The probability of the union of two or more events is the probability that at least one of the events will occur. The probability of the union of