Play Button – Play Stop Forward Buttons – Stop Button Diagram – Play Button Gif – Play Button jpg – Play Stop Buttons – Remote Control Buttons. Image of Play button. play button
Play Button – Play Stop Forward Buttons

Charts, Graphs and Diagrams
Play Button – Play Stop Forward Buttons – Stop Button Diagram – Play Button Gif – Play Button jpg – Play Stop Buttons – Remote Control Buttons. Image of Play button. play button

Bacon as money. Wait, what? Baconomy Chart. Alternative currency infographic. Alternative money chart. Bacon is used for currency diagram. Using bacon as barter. Barter alternative currency chart diagram. How to use bacon as money? Market price of various goods and services as measured in alternative currency – bacon. Source: http://www.paydayloan.co.uk/Fun-Stuff/baconomy-the-art-of-bacon-barter.html https://ygraph.com/chart/2551

Drinking Chart. Drinking Diagram. Drinking and Sex Chart. Drinking and Sex Infographic. Alcohol Chart. Alcohol Diagram. Alcohol increases self-confidence, sexual desire, sociability. Blood Alcohol Content Chart. How drunk am I? Blood Alcohol Content Chart. BAC Scale Chart. Conditions under various alcohol levels. Beer Goggles Diagram. One Night Stand Chart. Morning After Diagram. Percentage of couples met in a bar diagram. Drinking Scale Chart. Source: http://www.freedating.co.uk/infographics/science-of-beer-goggles.html https://ygraph.com/chart/2566

Germs and Bacteria Chart. Germs Stats Chart. How Dirty is My Home? Bacteria in my home Chart – Germs in my Kitchen Diagram. Illness Transmission Chart. Risk of Sickness Transfer. Workplace germs – workplace bacteria. High Germ Zones in your home and work. Restaurant germs and bacteria. Germs on Computer, keyboards, office desks, light switches and office phones. Workplace germs statistics. House bacteria stats. Bacteria Stats Chart. Source: http://www.ionswipes.com/dirty-habits/ https://ygraph.com/chart/2560

Colleges Chart. USA Colleges Chart. Top USA Universities Chart. US Colleges by Social Media presence. Social Networks and USA Colleges. How Stanford, Harvard, MIT, Drake, LSU, Texas, Yale, Berkeley colleges rank in social media websites such as Facebook, Twitter, Goolge+, Pinterest, Youtube. College Ranking Chart. Source: http://topcollegesonline.org/social/ https://ygraph.com/chart/2568

Interruptions in the workplace – Employee Interruptions Chart – Social Media Results in Disruption to Work – Effect of Social Media on Employee Productivity Chart and Infographic – Microsoft Survey of Employee Interruptions – Parallel vs. Sequential Tasks Completion – Comparison of Parallel to Sequence Activities – Productivity and Interruptions Costs Chart. Effect of Social Media Interruptions on American Economy Chart. Facebook and workplace. Twitter and workplace. Effect of Facebook and Twitter on Employee productivity and work. Source: http://redeapp.com/index.php/red-e-app-blog/entry/the-social-media-monster-is-alive https://ygraph.com/chart/2526

Consumer Profiling Chart. Consumer Targeting Diagram. Marketing Strategy Chart based on Client Personal Information. Coupon Chart. Coupon Saving Infographic. Tracking purchases by retailers diagram. Consumers receive coupon savings, retailers show revenue growth. Tracking Customers increases sales, improves client experience. Customer Tracking Statistics. Coupon Stats. How consumer targeting works? How to target customers? Source: http://www.camcode.com/asset-tags/you-are-not-special-but-your-purchases-are-infographic/ https://ygraph.com/chart/2524

Celebrities in Debt Chart. Poor Celebrities Diagram. Debt by Celebrity. Musicians who lost it all and became poor. MC Hammer, Michael Jackson, Toni Braxton, Tom Petty, Willie Nelson, Billy Joel, Meat Loaf in bankruptcy. Debt by famous people. Bankrupt Celebrities chart. Celebrities Infographic. Source: http://www.paydayloan.co.uk/Fun-Stuff/from-riches-to-rags.html https://ygraph.com/chart/2649

Cloud Computing Chart. Cloud Apps Diagram. Cloud Computing Diagram. Cloud Apps Chart. Cloud Computing Applications Chart. Computing Market 2013. Companies use of cloud computing. Cloud Companies Chart. Cloud Computing Considerations: pricing, features and functionality, service level agreement. Cloud computing features include data center security, secure and reliable storage, network security, application security, policy and compliance measures, data protection. Source: http://www.veracode.com/blog/2012/10/a-buyers-guide-to-cloud-apps-infographic/ https://ygraph.com/chart/2655

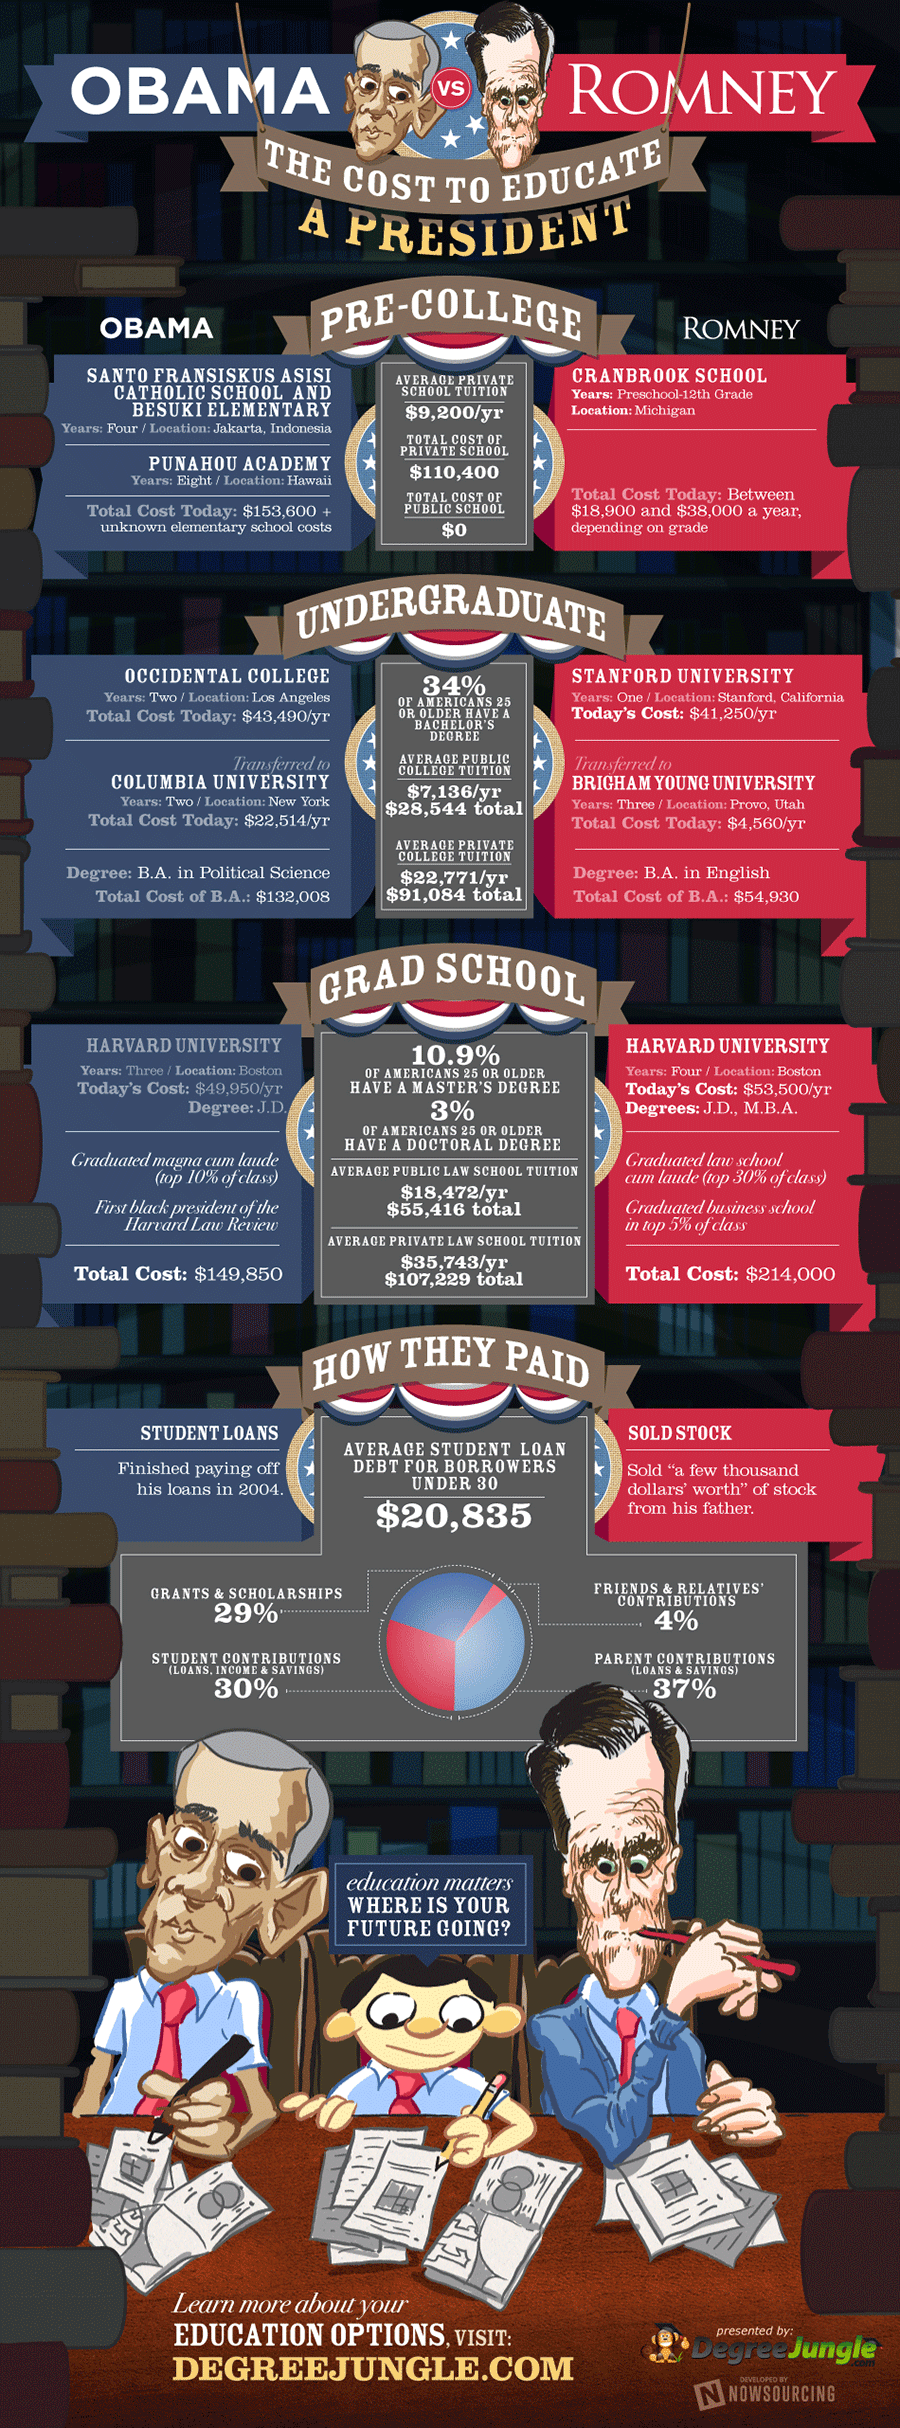
Obama vs Romney Chart. Obama Education. Romney Education. Cost of Education in USA. USA President education. Obama and Romney pre-college education, undergraduate degree, grad school. Academic background of president nominees: Obama and Romney. How Obama and Romney paid for their education. Average student loan in USA. Obama Academic background. Romney Academic background. Harvard University for Obama and Romney. Total Cost of president education. Source: http://www.degreejungle.com/guides/the-cost-to-educate-a-president https://ygraph.com/chart/2670
