The sine function is one of the most important and widely used functions in mathematics, especially in the field of trigonometry. It relates the angle of a right triangle to the ratio of two of its sides. Here is an overview of the sine function in about 1000 words.
The sine function is usually denoted by sin, and it takes an angle as its input. The output of the sine function is a number between -1 and 1, which represents the ratio of the length of the opposite side to the length of the hypotenuse in a right triangle that contains the given angle. For example, if we have a right triangle with an angle of 30 degrees, then the sine of 30 degrees is 0.5, because the opposite side is half of the hypotenuse.
The sine function can be defined for any real value of the angle, not just for the acute angles in a right triangle. One way to do this is to use the unit circle, which is a circle with radius 1 centered at the origin of a coordinate plane. Any point on the unit circle can be represented by an angle measured from the positive x-axis, called the standard position. The sine of the angle is then the y-coordinate of the point on the unit circle. For example, the point (0, 1) on the unit circle corresponds to an angle of 90 degrees, and the sine of 90 degrees is 1.
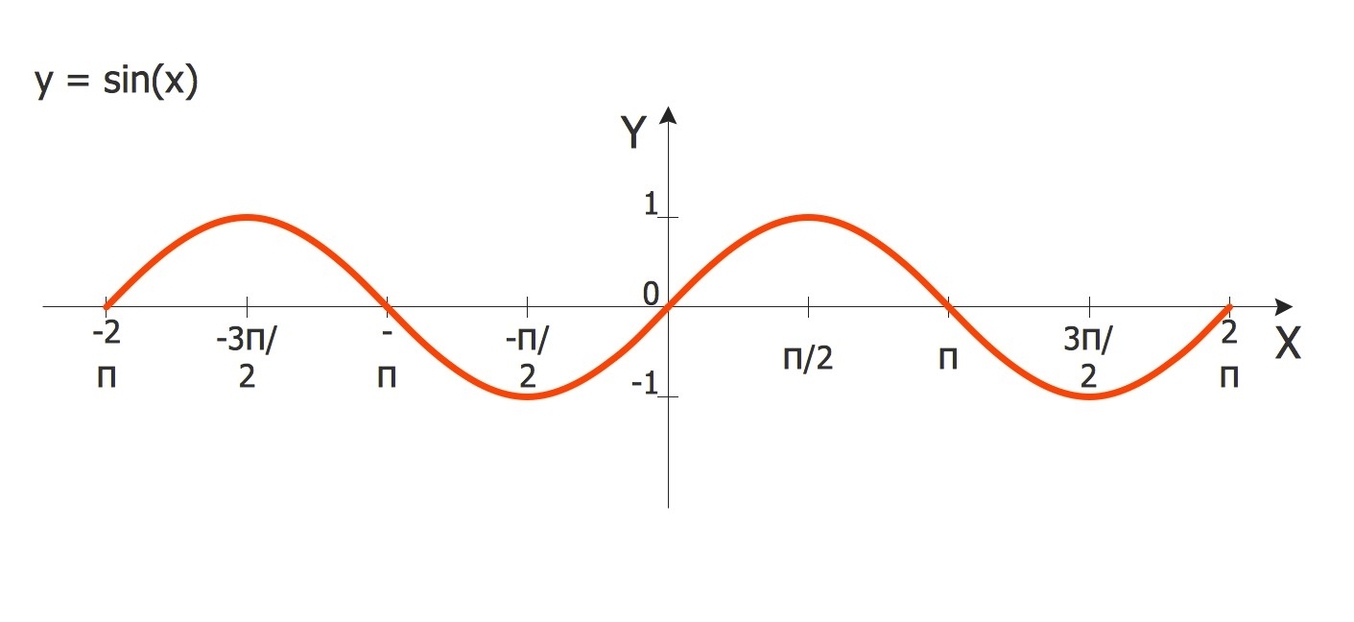
The sine function is periodic, which means that it repeats its values after a certain interval. The period of the sine function is 2? radians, or 360 degrees, because the unit circle has a circumference of 2?. This means that the sine of any angle is equal to the sine of the angle plus or minus any multiple of 2?. For example, the sine of 45 degrees is the same as the sine of 405 degrees or the sine of -315 degrees.
The sine function is also symmetric, which means that it has some properties of reflection and inversion. The sine function is odd, which means that the sine of the negative of an angle is the negative of the sine of the angle. For example, the sine of -60 degrees is -0.866, which is the opposite of the sine of 60 degrees, which is 0.866. The sine function is also symmetric about the line y = x, which means that the sine of an angle is equal to the cosine of its complement. For example, the sine of 30 degrees is 0.5, which is the same as the cosine of 60 degrees.
The sine function can be used to model many natural phenomena that involve periodic or oscillatory motion, such as sound and light waves, the position and velocity of harmonic oscillators, sunlight intensity and day length, and average temperature variations throughout the year. The sine function can