KG to LB – LB to KG – kg to lb – lb to k

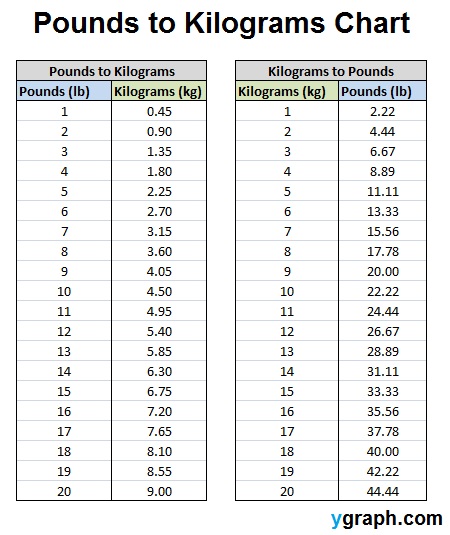
KG to LB – LB to KG – kg to lb – lb to kg chart. Weight conversion chart – kilograms into pounds and pounds into kilograms. Weight chart. Weight conversion chart. kg to lb weight chart. How to convert my weight in pounds to kg. Lb to kg converter. Weight chart. Weight conversion chart. lb to kg

KG to LB – LB to KG – kg to lb – lb to k

Pounds to Kilograms – Kilograms to Pound

Pounds to Kilograms – Kilograms to Pounds Chart – kg to lb – lb to kg – Kg to Lb chart – Kg to Lb conversion chart – kg to lb conversion table. Pounds to kg. Conversion Chart. Pounds to Kilograms Conversion Chart. Pounds to Kilograms Diagram. Pounds into kilograms, convert kilograms to pounds chart. How many pounds in a kilogram? Conversion calculator chart. pounds to kilograms

Pounds to Kilograms – Kilograms to Pound

The State of Infographics. Infographics

The State of Infographics. Infographics Chart. Infographics Trends. Infographics Statistics Chart. Infographics use graph. Trends in Infographics chart. Major topic trends by Infographics. Animals, business, computers, economy, education, entertainment, environment, food, gaming, geography, health, history, home, how to, love and sex infographics. Infographics statistics chart. Source: http://www.topmarketingschools.net/state-of-infographics/ https://ygraph.com/chart/2925

The State of Infographics. Infographics

What Does the Car of the Future Look Lik

What Does the Car of the Future Look Like? Future car. Future Auto. Future Car Chart. Future Car Stats. Future automobile characteristics including safety, autonomous cars, self-driving cars, efficiency, cars of today, self-driving cars benefits. Future car technology diagram. Infographic. Source: http://www.insurancequotes.com/self-driving-cars/ https://ygraph.com/chart/2923

What Does the Car of the Future Look Lik

It’s Startup Time In America Infographic

It’s Startup Time In America Infographic. Startup Chart. Business Startup Chart. Start a Business. Entrepreneurial Chart. Business Funding Diagram. Small Business Bank Loan Chart. Small business administration loans, venture capital, angel investors, asset backed funding. USA Startup map. Cloud and Business Startups. Source: http://blog.profitbricks.com/startup-infographic-cloud-computing-office-space-more/ https://ygraph.com/chart/2921

It’s Startup Time In America Infographic

CES Trends 2013 Infographic. Best Electr

CES Trends 2013 Infographic. Best Electronics Chart. Best TV. Best Television. Best Car Tech. Best Smart Phone. Best Camera. People’s Voice Award. Top electronics chart. Top TV. Top Television. Top Car Tech. Top smart phones. Top cameras. Source: http://www.bestchoicereviews.org/electronics/ces-trends-2013/ https://ygraph.com/chart/2943

CES Trends 2013 Infographic. Best Electr

Water Use Diagram – Water Use Chart – Us

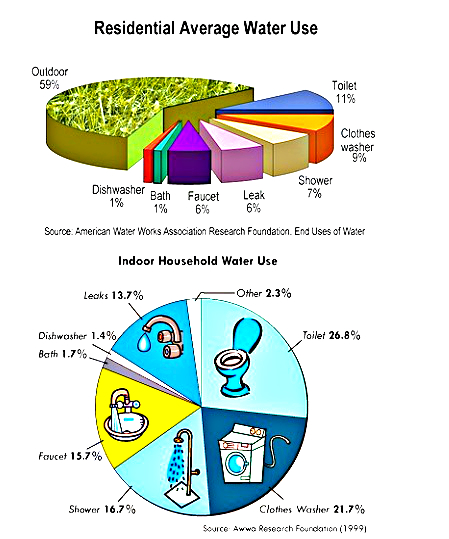
Water Use Diagram – Water Use Chart – Use of Water – Water Usage – Water Waste Chart – Water Waste Diagram – How Can you Conserve Water – Water Conservation Diagram – How water is used? Infographic, chart, diagram, table, pie chart. Source: AWWA water use diagram

Water Use Diagram – Water Use Chart – Us

Urine Color Chart – Urine Colors – Urine Chart

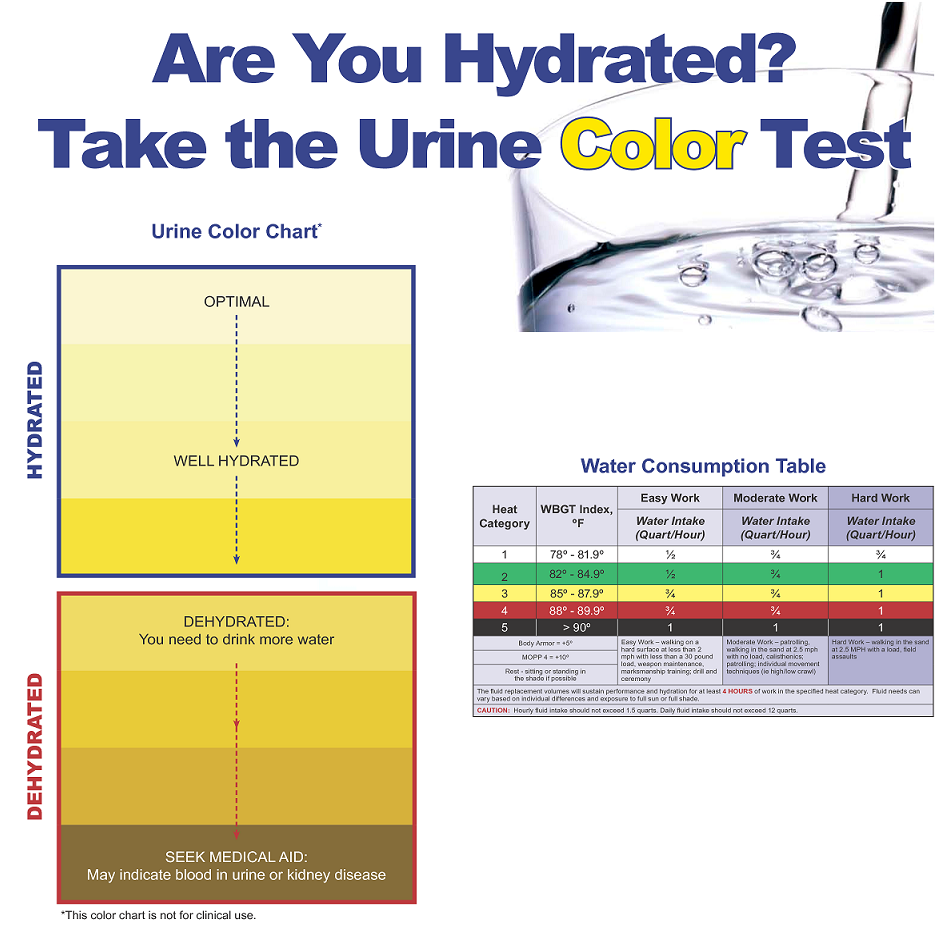
Urine Color Chart – Urine Colors – Urine Color – Piss Color Chart – Piss Color Test – Urine Color Test – Are you dehydrated? How much water do you drink? Water Consumption Chart. Water Consumption Table. Urine Water Test. Urine Colors Test. Source: USACHPPM urine color chart

Urine Color Chart – Urine Colors – Urine

How Much Water Should I Drink – Water Consumption

How Much Water Should I Drink – Water Consumption – Water Consumption Chart – Water Needs Chart – why drink water – Drinking Water – Water Consumption Diagram – Water Diagram – Water Needs Diagram. Source: Fullspike how much water should I drink

How Much Water Should I Drink – Water Co