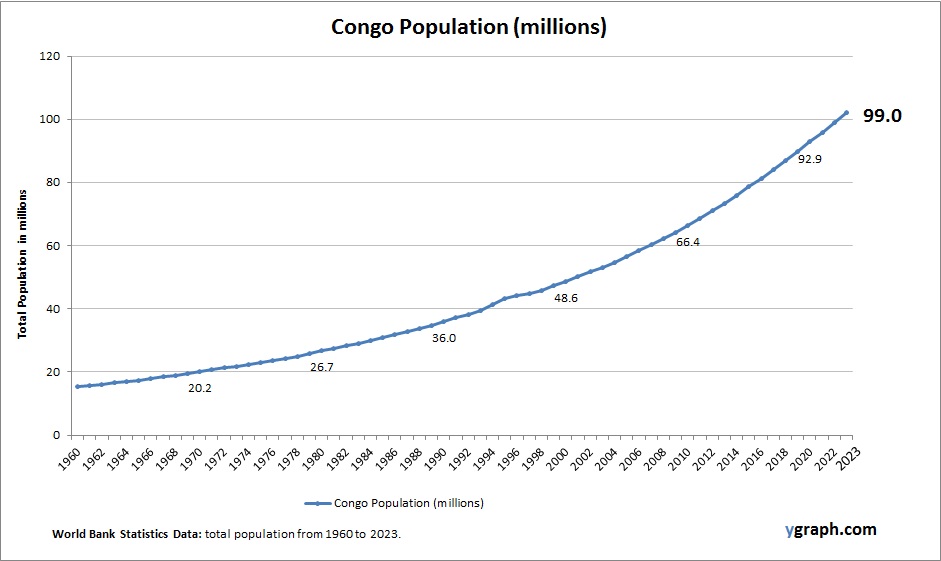
China Births per woman

This diagram presents China Births per woman. World Bank is the source of this birth data. Based on the latest demographics info provided for China.

China’s fertility rate has dropped significantly in recent decades due to government policies and socioeconomic changes. Although the one-child policy has been relaxed, birth rates remain below replacement level. This has led to a rapidly aging population and concerns about future labor force shortages, prompting new incentives to encourage families to have more children.

China Births per woman

Dominica Births per woman

This diagram presents Dominica Births per woman. World Bank is the source of this birth data. Latest births per woman information for Dominica.

Dominica has moderate fertility rates with a slow population growth trajectory. Migration and urbanization impact demographic trends, while social policies and healthcare improvements contribute to family planning and smaller family sizes.

Dominica Births per woman

South Korea Births per woman

This diagram presents South Korea Births per woman. The fertility rate statistics are compiled by World Bank. Latest births per woman information for South Korea.

South Korea has one of the lowest fertility rates globally, resulting in a rapidly aging population and population decline concerns. Economic pressures, career demands, and housing costs contribute to very low birth rates, prompting government efforts to support families and increase fertility.

South Korea Births per woman

Georgia Population

Chart above demonstrates Georgia Population. The country statistics are compiled by World Bank. Based on the latest available information for Georgia.

Georgia has a relatively small population experiencing slow growth and gradual aging due to low fertility rates and emigration. Urban areas such as Tbilisi attract most residents, while rural regions face population decline. Economic development and political stability influence migration trends and demographic patterns, with efforts focused on improving healthcare and reversing population decline.

Georgia Population

Andorra Population

Chart above demonstrates Andorra Population. World Bank is the source of this population data. Latest population information for Andorra.

Andorra’s population is small but stable, with low fertility rates balanced by immigration. The country enjoys high life expectancy and a strong economy, which supports a high standard of living and healthcare quality.

Andorra Population

Italy Population

Chart above demonstrates Italy Population. The country statistics are compiled by World Bank. Latest population information for Italy.

Italy has one of the world’s lowest fertility rates, contributing to a shrinking and aging population. Demographic concerns include labor shortages, increased dependency ratios, and economic strain on social services. Immigration partially offsets population decline, but long-term challenges persist.

Italy Population

Jamaica Births per woman

This diagram presents Jamaica Births per woman. This is according to World Bank birth stats by country. Latest births per woman information for Jamaica.

Jamaica has moderate fertility rates, which have declined steadily over recent decades due to better access to education, healthcare, and family planning. The population is slowly aging, and urbanization continues to shape the country’s demographic patterns.

Jamaica Births per woman

Costa Rica Population

This diagram presents Costa Rica Population. This is according to World Bank total population stats. Based on the latest demographics info provided for Costa Rica.

Costa Rica’s population has stabilized in recent years, with a declining fertility rate and increasing life expectancy. The country boasts a strong healthcare system and progressive social policies that support education and gender equality, contributing to demographic shifts. Urban areas are seeing slower growth compared to rural migration patterns, and the aging population is emerging as a new focus for public policy.

Costa Rica Population

Tajikistan Population

Chart above demonstrates Tajikistan Population. World Bank is the source of this population data. Latest population information for Tajikistan.

Tajikistan’s population is young and growing due to high fertility rates, though there have been signs of gradual decline. Migration, particularly labor migration abroad, impacts population size and composition. Economic development and improvements in healthcare are influencing demographic trends toward slower growth.

Tajikistan Population

Guinea Bissau Births per woman

Chart above demonstrates Guinea Bissau Births per woman. This is according to World Bank birth stats by country. Based on the latest demographics info provided for Guinea Bissau.

Guinea Bissau maintains high fertility rates driven by rural populations, cultural norms, and limited access to contraception. Population growth is rapid, and demographic challenges include improving healthcare and education infrastructure.

Guinea Bissau Births per woman