Evolution of a Brain. Evolution of Human Brain timeline. The origin of man and the theory of the evolution supported by the archaeology and palaeontology. Brain evolution graph. Source: HumanEvolution evolution of brain
Category Archives: science
Human Migration and Evolution. Human Mi
Human Migration and Evolution. Human Migration out of Africa. How human kind spread through the world. Human Evolution Timeline. Source: PaleoPlaybook https://ygraph.com/chart/1724
Human Migration and Evolution. Human Mi
Scatter Diagram – Scatter Diagram Exampl
Scatter Diagram – Scatter Diagram Example – Scatter Chart – Scatter Plot – Regression Line. The Scatter Diagram shows existence of a measurable relationship and plotting them on graph. This shows the correlation between the two sets of measurements. Source: Syque https://ygraph.com/chart/1727
Scatter Diagram – Scatter Diagram Exampl
Scatter Diagram Colleration. Strong Neg
Scatter Diagram Colleration. Strong Negative Colleration Graph. Weak Negative Colleration. Strong Positive Colleration Graph. Weak Positive Colleration. No Colleration Scatter Graph. Source: Toolbox https://ygraph.com/chart/1728
Scatter Diagram Colleration. Strong Neg
Tree Diagram – Tree Chart – Tree Diagram
Tree Diagram – Tree Chart – Tree Diagram Math – Tree Graph – Tree Probability Graph. Tree diagram is the easiest way to solve the probability problems.Tree diagram shows the outcome of any event. Source: TutorVista https://ygraph.com/chart/1729
Tree Diagram – Tree Chart – Tree Diagram
Tree diagram showing how to count probab
Tree diagram showing how to count probabilities. Tree Diagram Chart. Tree Diagram Math Equations. Source: Regentsprep https://ygraph.com/chart/1730
Tree diagram showing how to count probab
Standard Model – The Standard Model – Ph
Standard Model – The Standard Model – Physics Standard Model – Standard Model Diagram – Standard Model Physics – standard model of particle physics – Standard model wiki. Description of the elementary particles and how they interact Source: nocenslupus https://ygraph.com/chart/1624
Standard Model – The Standard Model – Ph
The Standard Model, essentially takes in
The Standard Model, essentially takes into consideration Einstein’s theory. Standard model of elementary particles encompasses four fundamental forces according: Gravitational Force, Electromagnetic Force, Weak Force, Strong Force. Standard model chart. Source: Odec https://ygraph.com/chart/1625
The Standard Model, essentially takes in
Venn Diagrams – Venn Chart – Venn Model
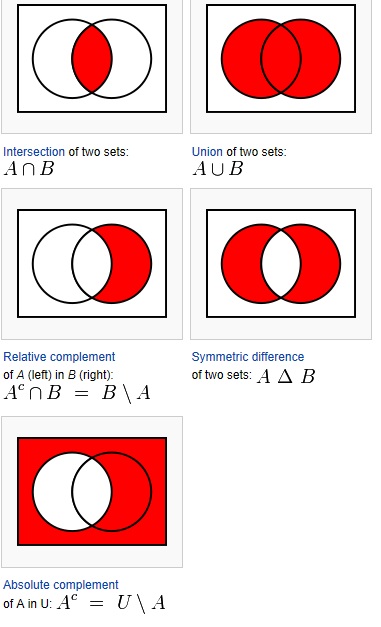
Venn Diagrams – Venn Chart – Venn Model – Venn Diagrams – Set Diagram – Set Diagrams. Venn diagrams or set diagrams are diagrams that demonsrate all possible logical relations and connections between a finite number of of sets. Business Venn Diagrams. Source: Wiki venn chart
Venn Diagrams – Venn Chart – Venn Model
Venn Diagram Math. Venn Diagram showing
Venn Diagram Math. Venn Diagram showing numbers: natural, integer, rational, real algebraic, real numbers. Set diagram showing various numbers. Math number type explanations. Source: ThinkZone venn diagram