Skip to content
cropped logo

Ygraph

Charts, Graphs and Diagrams

Menu

Primary menu

  • Submit Diagram
  • Science
  • Business
  • Economy
    • GDP
  • Demographics
  • Explained
    • Signs
    • Maps
  • Health
  • Anatomy
  • Sizes

Political Ideology Venn Diagram

Political Ideology Venn Diagram

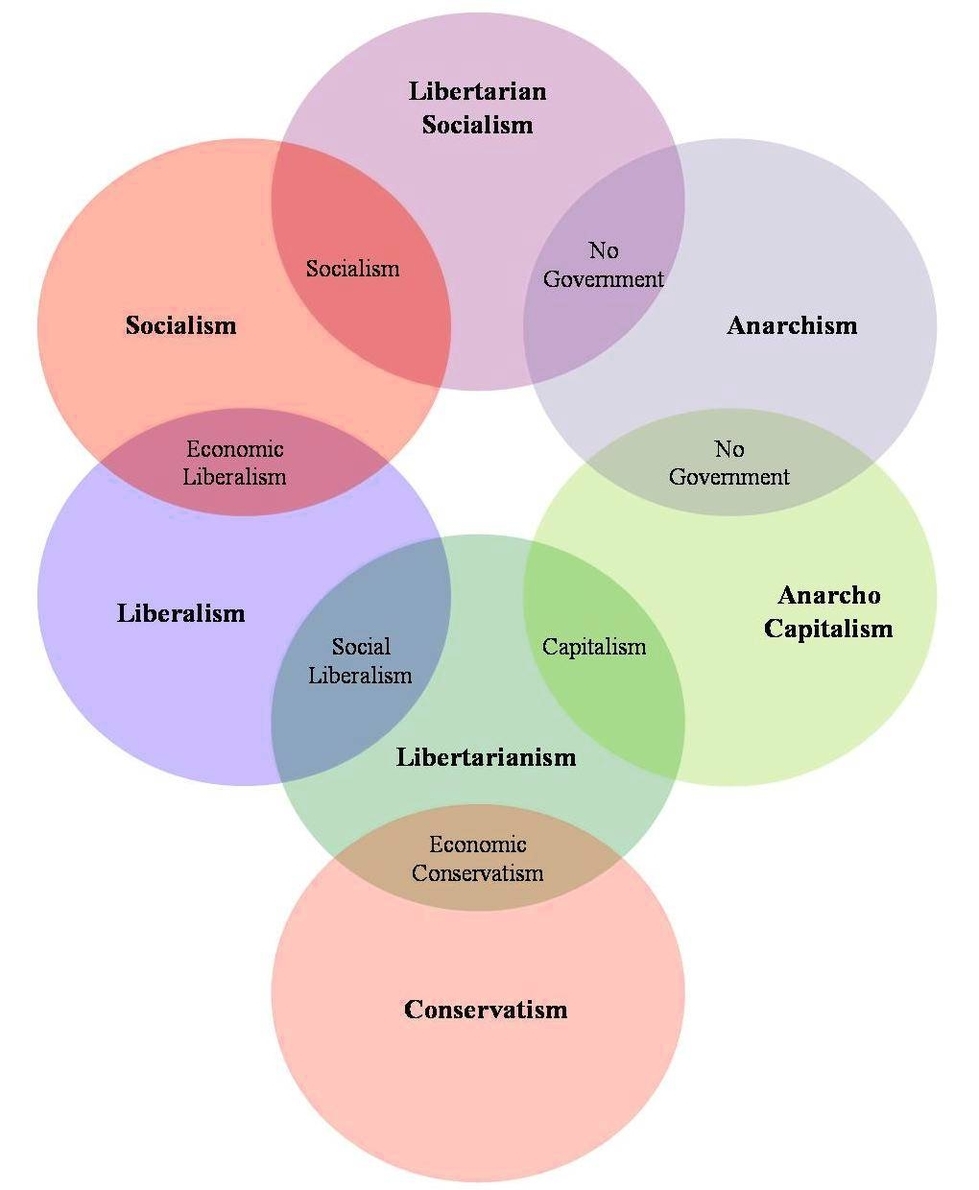
Political Ideology Venn Diagram: A political ideology Venn diagram visually represents the similarities and differences between various political ideologies. By overlapping circles, it highlights the commonalities and distinctions among ideologies such as liberalism, conservatism, and socialism.

ideology relationships, left vs right overlap, moderate political views chart, party comparison visual, political ideology venn diagram

Post navigation

← Previous Previous post: Generative Artificial Intelligence
Next → Next post: Haiti Population

Primary Sidebar Widget Area

Top Diagrams

Latest Posts

  • How to Stop Time from Flying
  • Mesophiles Bacteria Diagram
  • Europe & Central Asia Births per woman
  • Mongolia Population
  • Computer Science Diagram
  • Physics Definition, Branches And Importance
  • Gibraltar Births per woman
  • Botswana Population
  • R Venn Diagram
  • Geographic Information System
  • Oman Population
  • Central Europe and the Baltics Births per woman
  • Baby Clothes Size Chart
  • how to deal with preteen.jpg
  • Political View Chart Illustrated
  • Brain Structure Described In Detail

Top Tags

  • sizes (35)
  • size chart (35)
  • size conversion (35)
  • economy chart (33)
  • economy graph (33)
  • economy diagram (33)
  • cell (29)
  • cell diagram (29)
  • cell illustration (29)
  • window (24)
  • window diagram (24)
  • types of windows (24)
  • origami (16)
  • origami steps (16)
  • how to make origami (16)
  • biology (16)
  • biology diagram (16)
  • yoga (8)
  • yoga routine (8)
  • yoga poses (8)

Categories

  • anatomy
  • Business
  • chart
  • Demographics
  • Eco
  • Ecom
  • Economy
  • Explained
  • GDP
  • Health
  • Maps
  • notice
  • science
  • Signs
  • Sizes
  • Uncategorized

Useful Resources

  • Chart Diagram
  • Meme Gif
  • Logo Sign
  • Human Anatomy
  • Graph Diagram
  • Economy GDP
  • Twitter
Copyright © 2026 Ygraph. All Rights Reserved.
Theme: Catch Box by Catch Themes
Scroll Up
WP Twitter Auto Publish Powered By : XYZScripts.com