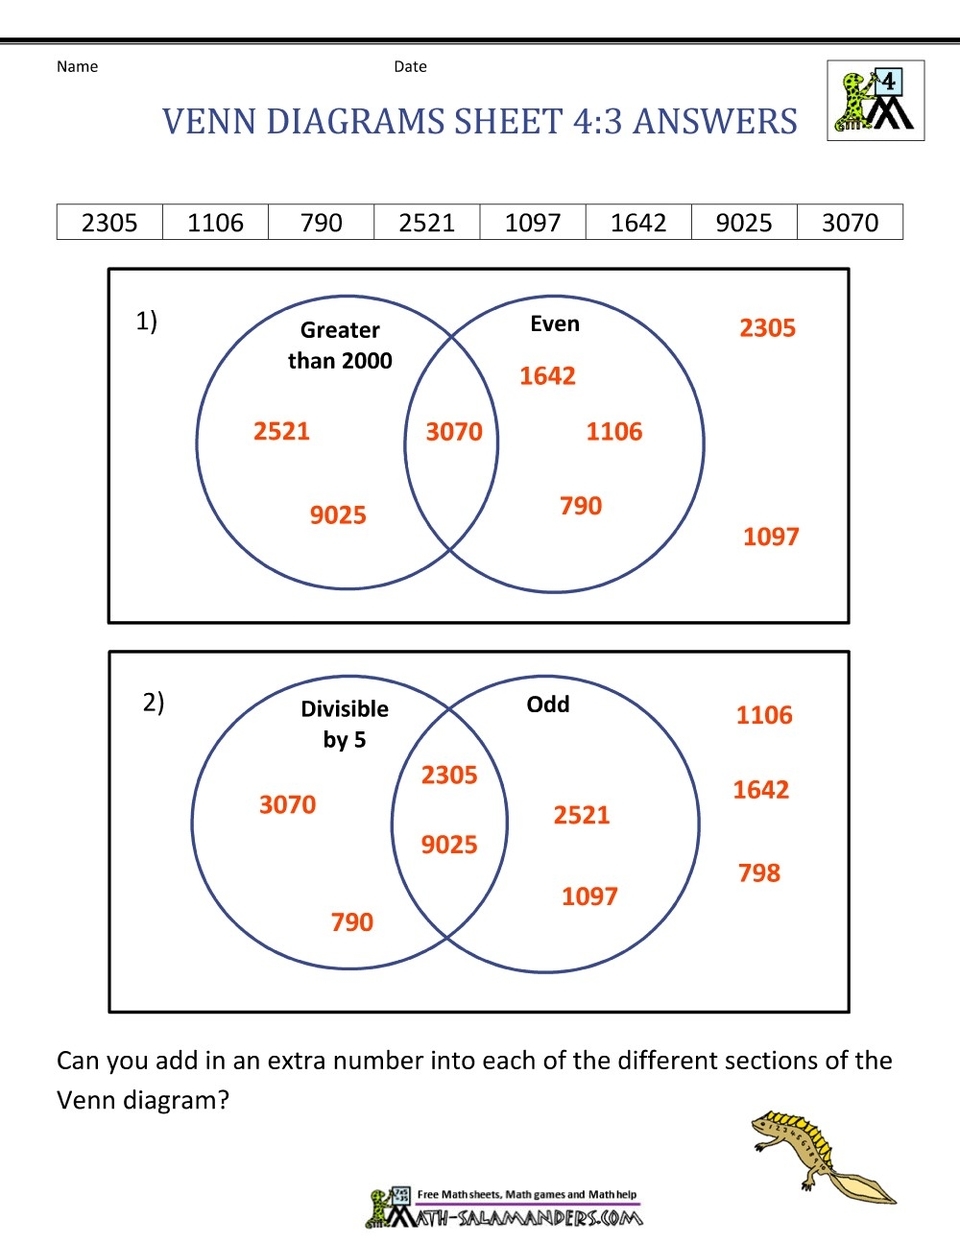
A Venn diagram is a graphical representation of the relationships between sets. It is named after John Venn, an English logician and philosopher who introduced the concept in 1880. Venn diagrams are used to illustrate the logical relationships between two or more sets of items. They are often used in mathematics, statistics, computer science, and other fields to help visualize complex data.
Venn diagrams consist of overlapping circles or other shapes that represent sets. The items in each set are represented by points within the circle or shape. The overlapping areas between the circles or shapes represent the items that are common to both sets. The non-overlapping areas represent the items that are unique to each set.
Venn diagrams can be used to illustrate a variety of logical relationships between sets. For example, they can be used to show the intersection of two or more sets, the union of two or more sets, the difference between two sets, or the complement of a set.
There are many different types of Venn diagrams, including two-set diagrams, three-set diagrams, and more. Two-set diagrams are the most common type and are often used to illustrate the relationship between two sets of items. Three-set diagrams are used to illustrate the relationship between three sets of items.
Venn diagrams can be used in a variety of ways. For example, they can be used to help students understand the relationships between different sets of data. They can also be used to help researchers visualize complex data sets and identify patterns and relationships between different variables.
Venn diagrams can be created using a variety of tools, including software programs, online tools, and paper and pencil. There are many different types of Venn diagram worksheets available online that can be used to help students practice creating and interpreting Venn diagrams. These worksheets often include a variety of different types of problems, such as finding the intersection of two sets, finding the union of two sets, or finding the difference between two sets.
In conclusion, Venn diagrams are a powerful tool for visualizing the relationships between sets of data. They are used in a variety of fields to help researchers and students
