Skip to content
cropped logo

Ygraph

Charts, Graphs and Diagrams

Menu

Primary menu

  • Submit Diagram
  • Science
  • Business
  • Economy
    • GDP
  • Demographics
  • Explained
    • Signs
    • Maps
  • Health
  • Anatomy
  • Sizes

Auto Insurance Rate by Sex (Male, Female

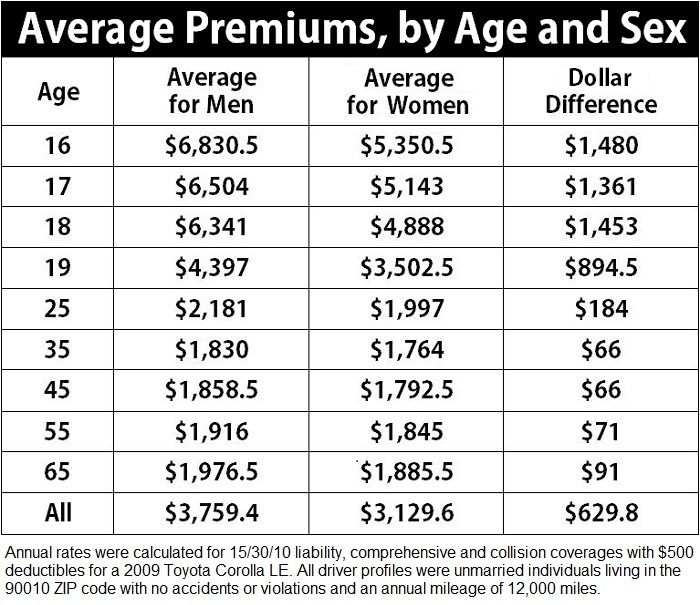
Auto Insurance Rate by Sex (Male, Female) and Age. Car insurance premiums decrease with age and are lower for women than men. Difference in automobile insurance costs. Source: http://www.prweb.com/releases/how-gender-affects-cost/auto-insurance/prweb5243394.htm https://ygraph.com/chart/1255

Auto Insurance Rate by Sex (Male, Female
Post navigation

← Previous Previous post: Poker Starting Hand Chart – Poker Chart
Next → Next post: Dividends Chart. Impact of Dividends vs

Primary Sidebar Widget Area

Top Diagrams

Latest Posts

  • How to Stop Time from Flying
  • Kazakhstan Population
  • Political Process Definition
  • Horseshoe Political Theory
  • West Bank and Gaza Births per woman
  • Thailand Population
  • Interdisc
  • Bahrain Births per woman
  • Middle East & North Africa Population
  • Ks2 Scientific Diagrams
  • Latin America & Caribbean (excluding high income) Population
  • Ecuador Population
  • Geography Of The Four Seasons
  • Human Physiology Chart
  • Timing Market And Economic Cycle Phases
  • Mali Births per woman

Top Tags

  • sizes (35)
  • size chart (35)
  • size conversion (35)
  • economy chart (33)
  • economy graph (33)
  • economy diagram (33)
  • cell (29)
  • cell diagram (29)
  • cell illustration (29)
  • window (24)
  • window diagram (24)
  • types of windows (24)
  • origami (16)
  • origami steps (16)
  • how to make origami (16)
  • biology (16)
  • biology diagram (16)
  • yoga (8)
  • yoga routine (8)
  • yoga poses (8)

Categories

  • anatomy
  • Business
  • chart
  • Demographics
  • Eco
  • Ecom
  • Economy
  • Explained
  • GDP
  • Health
  • Maps
  • notice
  • science
  • Signs
  • Sizes
  • Uncategorized

Useful Resources

  • Chart Diagram
  • Meme Gif
  • Logo Sign
  • Human Anatomy
  • Graph Diagram
  • Economy GDP
  • Twitter
Copyright © 2025 Ygraph. All Rights Reserved.
Theme: Catch Box by Catch Themes
Scroll Up
WP Twitter Auto Publish Powered By : XYZScripts.com