Psychology Mind Map: A psychology mind map is a visual tool that organizes information about psychological concepts, theories, and practices. It uses branches and nodes to connect related ideas, helping to structure and simplify complex information.
Your Graphs, Charts and Diagrams
Psychology Mind Map: A psychology mind map is a visual tool that organizes information about psychological concepts, theories, and practices. It uses branches and nodes to connect related ideas, helping to structure and simplify complex information.
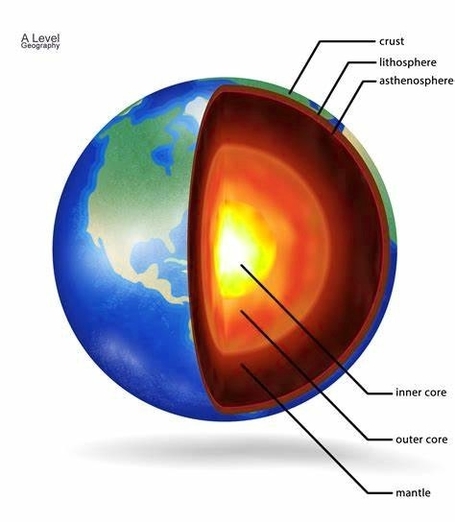
Earth is composed of four distinct layers: the inner core, the outer core, the mantle, and the crust . The inner core is a solid metal ball made mostly of iron and nickel, with a radius of 1,220 kilometers (758 miles) . It spins a bit faster than the rest of the planet and is intensely hot, with temperatures sizzling at 5,400° Celsius (9,800° Fahrenheit) . The outer core is also made from iron and nickel, but in liquid form. It is heated largely by the radioactive decay of the elements uranium and thorium, and churns in huge, turbulent currents that generate electrical currents, which in turn generate Earth’s magnetic field . The mantle is Earth’s thickest layer, at close to 3,000 kilometers (1,865 miles) thick, and is semi-solid . The crust is the outermost layer of Earth, and is the thinnest layer, ranging from 5 to 70 kilometers (3 to 44 miles) thick .
The Earth’s layers are formed, heated, and moved by various forces . The inner core is believed to be formed by the solidification of the outer core, while the outer core is believed to be formed by the cooling of the Earth’s original molten state . The mantle is heated by the residual heat from the Earth’s formation, as well as by the decay of radioactive isotopes . The crust is formed by the cooling of the Earth’s original molten state, and is broken into tectonic plates that move around the surface of the Earth .
The Earth’s layers have different physical and chemical properties, which affect how they behave and interact with each other . For example, the mantle is denser than the crust, and so the crust “floats” on top of the mantle . The different layers also have different temperatures and pressures, which affect the behavior of the materials within them .
In summary, the Earth is composed of four distinct layers: the inner core, the outer core, the mantle,
The term “Cold War Flow” is not a commonly used phrase in the context of the Cold War. However, I can provide you with an overview of the Cold War and its major events.
The Cold War was a period of geopolitical tension between the United States and the Soviet Union and their respective allies, which lasted from the end of World War II in 1945 until the collapse of the Soviet Union in 1991. The term “cold” was used to describe the lack of direct military action between the two superpowers, although there were many proxy wars fought in various parts of the world.
The origins of the Cold War can be traced back to the end of World War II, when the uneasy wartime alliance between the United States and Great Britain on the one hand and the Soviet Union on the other began to unravel. By 1948, the Soviets had installed left-wing governments in the countries of Eastern Europe that had been liberated by the Red Army. The Americans and the British feared the permanent Soviet domination of Eastern Europe and the threat of Soviet-influenced communist parties coming to power in the democracies of Western Europe.
The Cold War was waged on political, economic, and propaganda fronts and had only limited recourse to weapons. The two superpowers engaged in an arms race, with each side developing more powerful nuclear weapons. The United States and the Soviet Union also engaged in a space race, with each side trying to outdo the other in space exploration and technology.
The Cold War was marked by several major events, including the Cuban Missile Crisis, the Berlin Crisis, and the Vietnam War. The Cuban Missile Crisis occurred in 1962 when the Soviet Union placed nuclear missiles in Cuba, which is just 90 miles from the United States. The United States responded with a naval blockade of Cuba, and the two superpowers came close to nuclear war.
The Berlin Crisis occurred in 1961 when the Soviet Union erected the Berlin Wall to prevent East Germans from fleeing to the West. The United States responded by airlifting

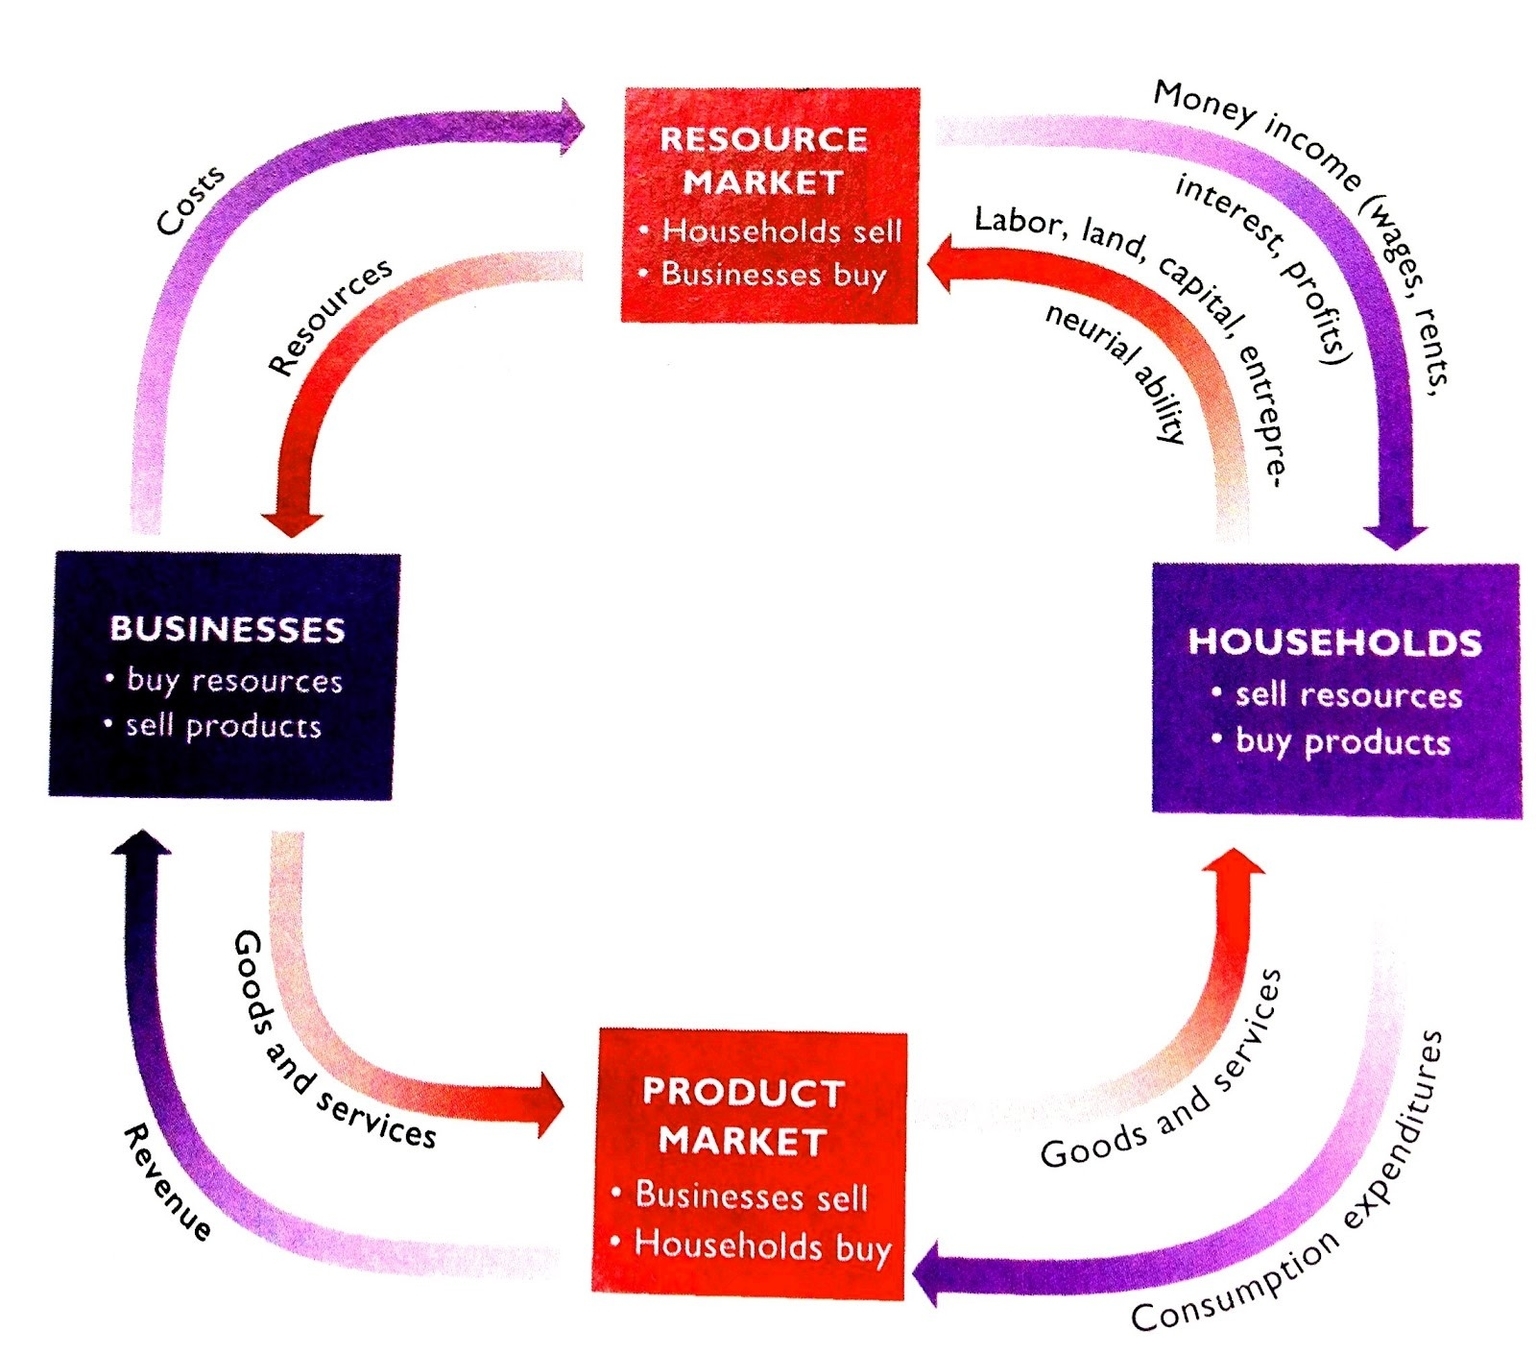
Economic System Diagram: An economic system diagram illustrates how societies or governments organize and distribute resources, services, and goods. It typically includes elements like households, firms, and markets, showing interactions in goods, services, and labor markets.

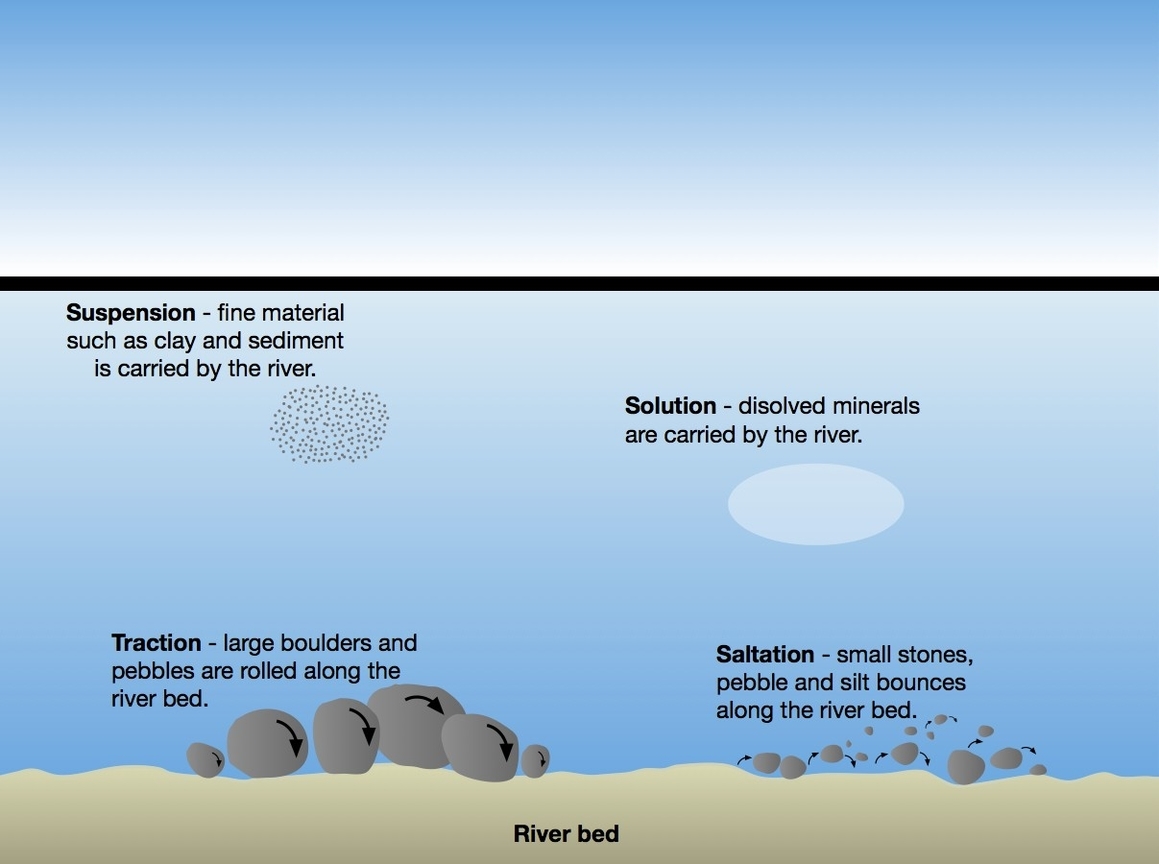
River transportation processes are the ways in which a river moves its load of sediment, rocks, and other materials downstream. There are four main types of river transportation processes: traction, saltation, suspension, and solution .
Traction is the process by which large, heavy pebbles are rolled along the river bed. This is most common near the source of a river, as here the load is larger . Saltation is the process by which pebbles are bounced along the river bed, most commonly near the source . Suspension is the process by which lighter sediment is suspended (carried) within the water, most commonly near the mouth of the river . Finally, solution is the transport of dissolved chemicals, which varies along the river depending on the presence of soluble rocks .
As a river flows downstream, the rates of erosion, transportation, and deposition change. In the upper course of a river, the rate of erosion is high, and the river is steep and narrow. The river’s load is mostly transported by traction and saltation. In the middle course, the river is wider and deeper, and the rate of erosion is lower. The river’s load is mostly transported by suspension. In the lower course, the river is wide and flat, and the rate of deposition is high. The river’s load is mostly transported by solution .
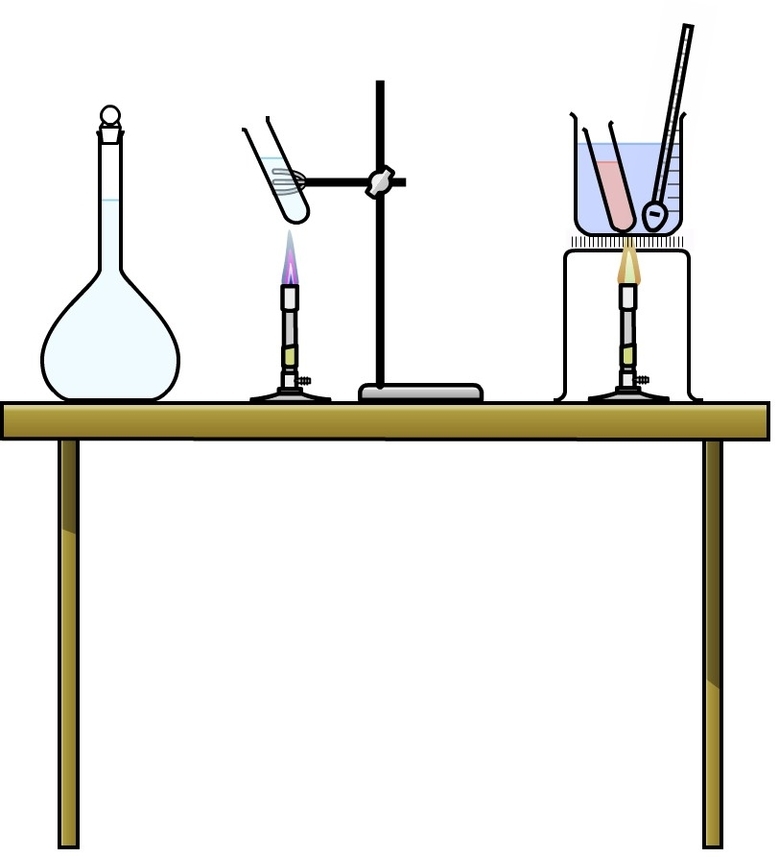
Chemistry Experiment Illustration is a visual representation of a chemical experiment. It is used to help students and teachers understand the setup of a laboratory experiment. There are many different types of Chemistry Experiment Illustrations available, ranging from simple diagrams to more complex illustrations.
One of the most popular tools for creating Chemistry Experiment Illustrations is Chemix . Chemix is an online editor that allows users to create diagrams of common laboratory equipment and lab setups for science experiments. It is designed to be simple and intuitive, making it easy for both students and teachers to use.
Another way to find Chemistry Experiment Illustrations is by browsing stock image websites such as iStock . iStock has over 62,000 royalty-free illustrations and vector graphics available for download. These illustrations can be used for a variety of purposes, including educational materials, presentations, and more.
If you are looking for a specific type of Chemistry Experiment Illustration, you can also try searching for it on IconScout . IconScout has over 2,000 vector illustrations related to chemistry experiments that can be downloaded in a variety of formats, including SVG, PNG, EPS, AI, and JPG.

The Circular Flow Model is a fundamental concept in macroeconomics that describes how money, goods, and services move between sectors in an economic system . The model is used to measure a country’s national income or GDP by tracking the flows of money between the sectors . The model is also known as the Circular Flow of Income .
The basic circular flow model consists of two sectors: households and businesses . In this model, money flows from households to businesses as consumer expenditures in exchange for goods and services produced by the businesses. The money then flows back from businesses to households for the labor that individuals provide . This model is the most basic circular flow model of an economy .
In reality, there are more parties participating in a more complex structure of circular flows. The five-sector model consists of households (the public sector), businesses, government, the foreign sector, and the financial sector . Money flows from households and businesses to the government in the form of taxes in this model . The government pays back in the form of government expenditures through subsidies, benefit programs, public services, etc. . The foreign sector involves the import and export of goods and services, and the financial sector includes banks and other financial institutions .
The circular flow model has been widely applied in different studies, with significant impacts on the understanding of economics . Here are some examples of the significance of the model:
1. National Income Accounting: The circular flow model is used to measure a country’s national income or GDP by tracking the flows of money between the sectors . This helps economists understand the overall health of an economy.
2. International Trade: The circular flow model is used to explain the impact of international trade on an economy . The model shows how imports and exports affect the circular flow of money and goods between sectors.
3. Fiscal Policy: The circular flow model is used to explain the impact of fiscal policy on an economy . Fiscal policy refers to the government’s use of taxes and spending to influence the economy. The model shows how changes in government spending and taxation
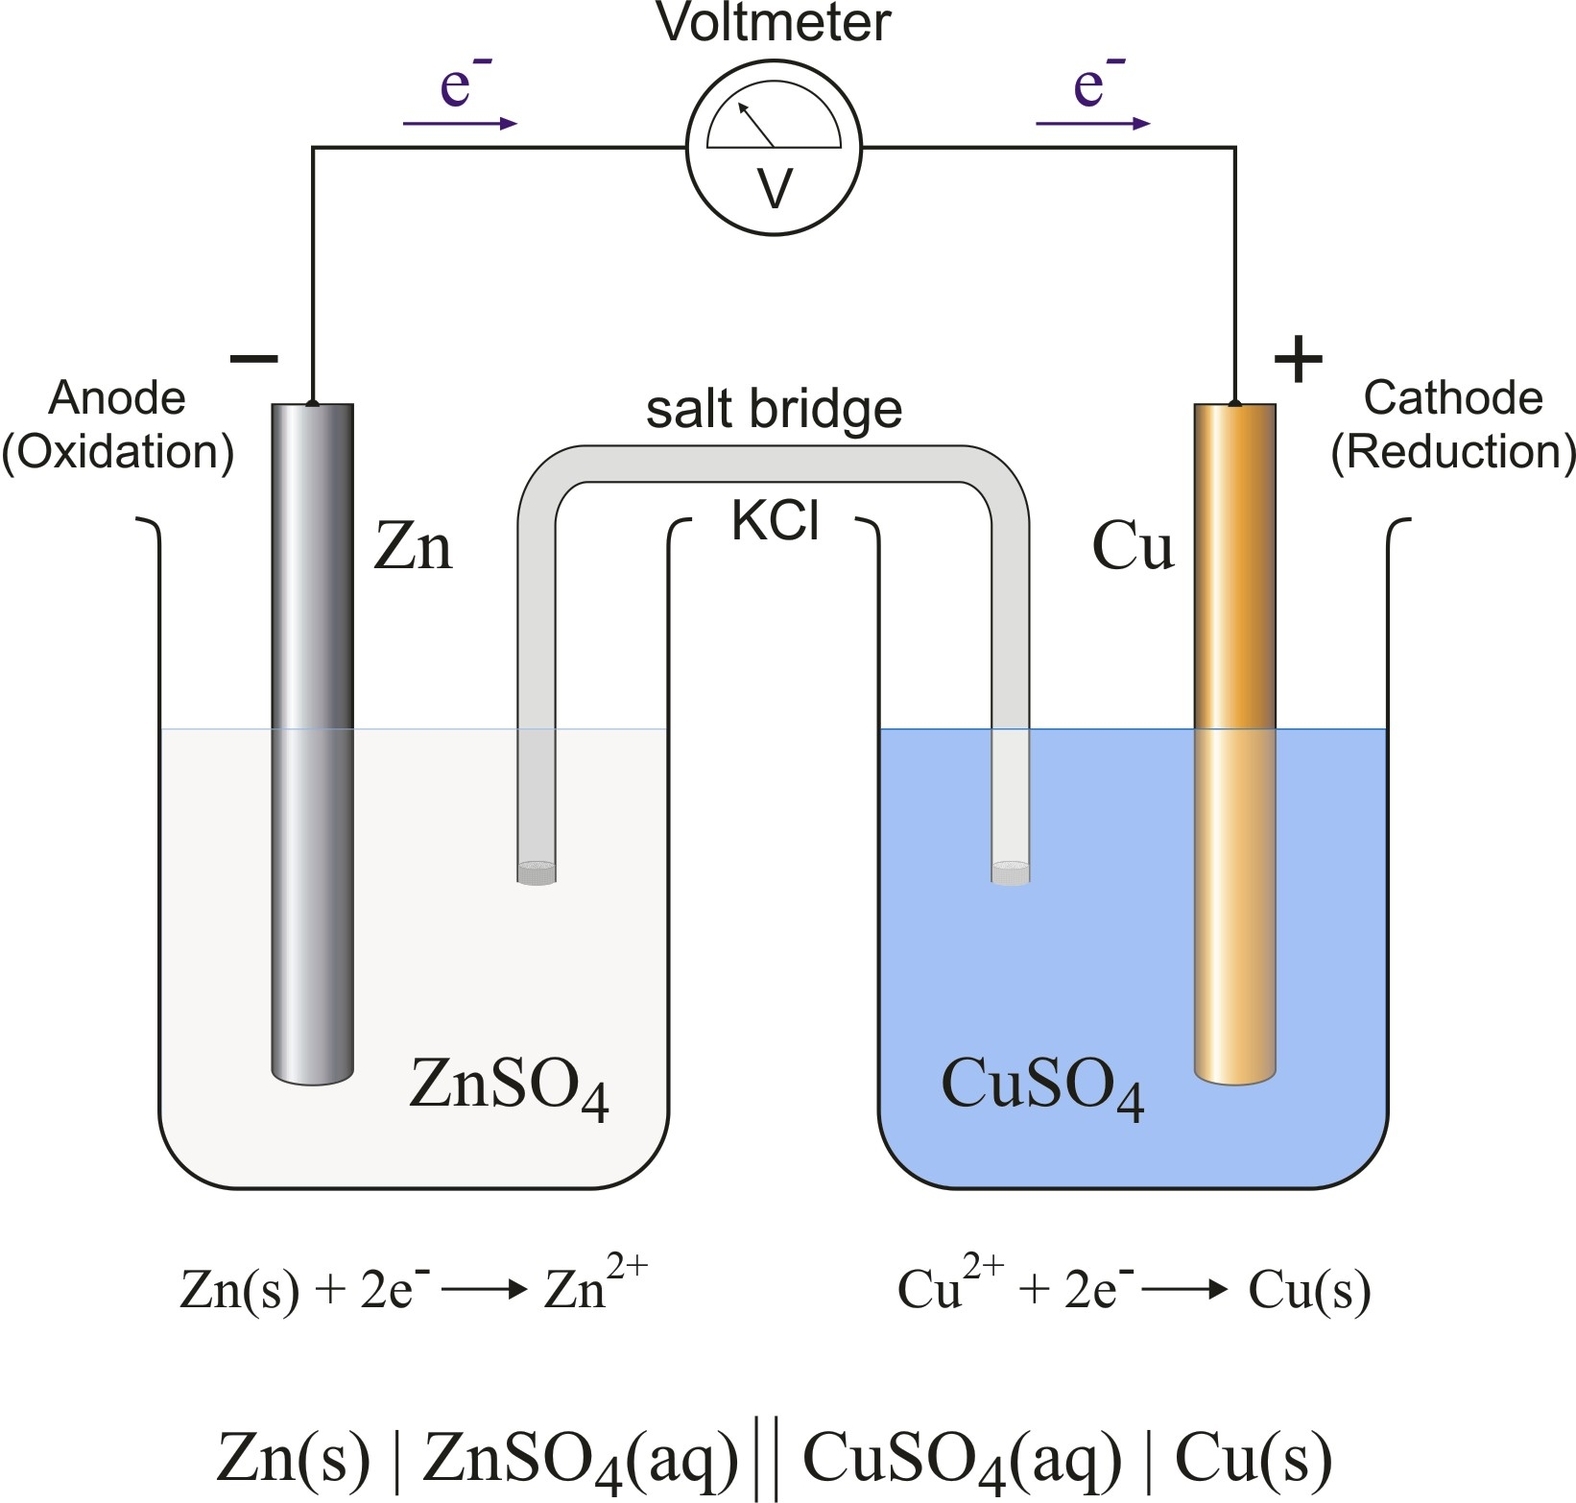
A galvanic cell is a device that converts chemical energy into electrical energy by using spontaneous redox reactions. It consists of two electrodes, each immersed in an electrolyte solution that contains ions of the same metal as the electrode. The electrodes are connected by a wire and a salt bridge or a porous membrane that allows the flow of ions but prevents the mixing of the solutions.
The electrode where oxidation occurs is called the anode, and the electrode where reduction occurs is called the cathode. The anode loses electrons and the cathode gains electrons, creating an electric potential difference between them. This potential difference drives the flow of electrons through the external circuit, generating an electric current. The magnitude of the potential difference depends on the nature of the electrodes and the electrolytes, and can be calculated using the Nernst equation or a standard reduction potential table.
A common example of a galvanic cell is the Daniell cell, which uses zinc and copper electrodes and their respective sulfate solutions as electrolytes. The half-reactions and the overall reaction for the Daniell cell are:
$$text{Anode: } text{Zn}(s) rightarrow text{Zn}^{2+}(aq) + 2text{e}^-$$
$$text{Cathode: } text{Cu}^{2+}(aq) + 2text{e}^- rightarrow text{Cu}(s)$$
$$text{Overall: } text{Zn}(s) + text{Cu}^{2+}(aq) rightarrow text{Zn}^{2+}(aq) + text{
Science lab drawing is the process of creating visual representations of scientific concepts, experiments, or apparatus. Science lab drawing can be used for various purposes, such as:
– Illustrating scientific publications, presentations, or posters
– Communicating scientific ideas or findings to a wider audience
– Enhancing scientific education or learning
– Stimulating scientific creativity or imagination
cience lab drawing can be done using different methods, tools, and styles, depending on the needs and preferences of the creator. Some common methods and tools are:
– Hand-drawing with pencils, pens, markers, or brushes
– Digital drawing with software such as [BioRender](^1^), [Chemix](^2^), or Adobe Illustrator
– 3D modeling with software such as Blender, Maya, or SketchUp
– Photography or microscopy with cameras or microscopes
ome common styles of science lab drawing are:
– Realistic: depicting the subject as accurately and faithfully as possible, using realistic colors, shapes, and textures
– Simplified: omitting unnecessary details or using symbols, icons, or diagrams to represent the subject, using simple colors, shapes, and lines
– Artistic: adding personal touches or artistic elements to the subject, using expressive colors, shapes, and textures
cience lab drawing can be challenging, but also rewarding and fun. It requires a combination of scientific knowledge, artistic skills, and creativity. Science lab drawing can help scientists and students to:
– Improve their understanding of complex or abstract scientific phenomena
– Express their scientific vision or perspective
– Share their scientific discoveries or insights with others
– Inspire curiosity and interest in science
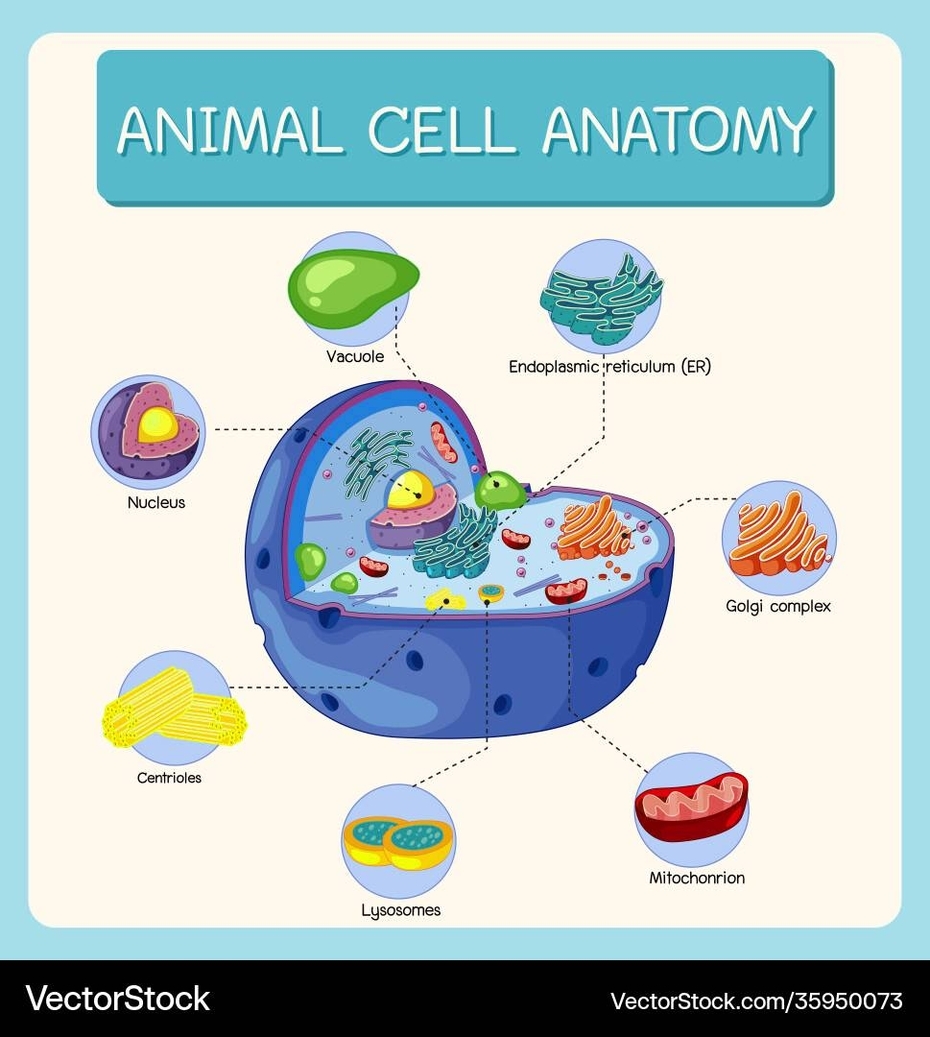
Here is an example of a science lab drawing that I created using BioRender: