Physical Features Landforms And Bodies Of Water

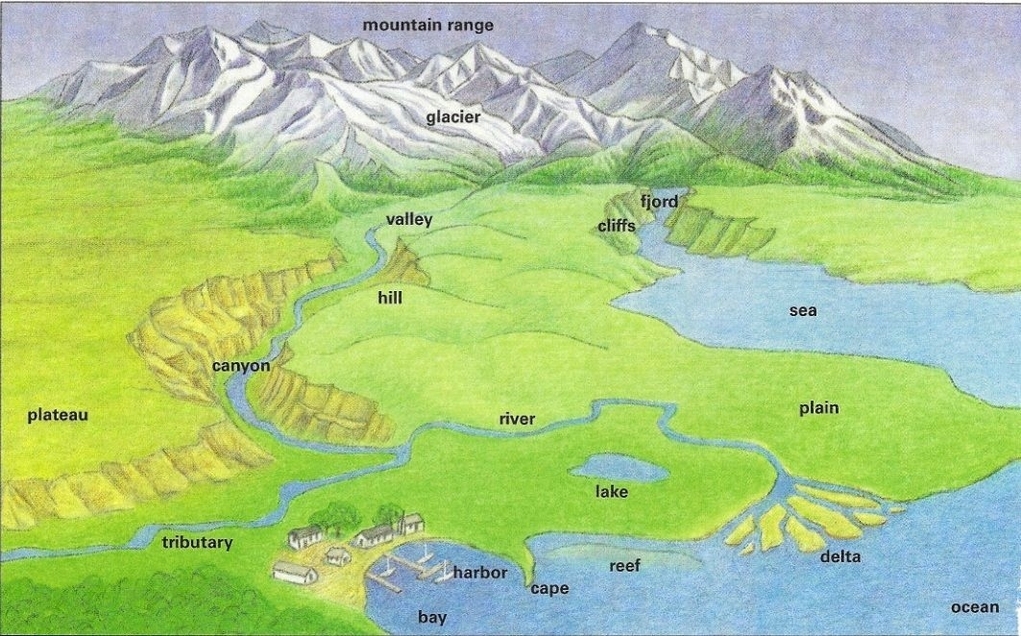
Physical features are the natural characteristics of the Earth’s surface, such as mountains, valleys, rivers, lakes, and oceans. They are shaped by various forces, such as plate tectonics, erosion, weathering, and climate. Physical features influence the distribution and diversity of life on Earth, as well as the human activities and cultures that develop in different regions.

Landforms are the specific shapes and forms of the Earth’s surface, such as hills, plateaus, canyons, and deltas. They are classified into three main types: mountains, plains, and plateaus. Mountains are high, steep, and rugged landforms that rise above the surrounding land. They are formed by the collision, folding, or volcanic activity of tectonic plates. Plains are flat or gently rolling landforms that cover large areas of land. They are formed by the deposition of sediments by rivers, glaciers, or wind. Plateaus are elevated landforms that have a flat or slightly sloping surface. They are formed by the uplift of large blocks of land or by the erosion of surrounding land.

Bodies of water are the areas of water that cover most of the Earth’s surface, such as oceans, seas, lakes, rivers, and streams. They are classified into two main types: saltwater and freshwater. Saltwater bodies of water are the oceans and seas that contain high concentrations of dissolved salts and minerals. They cover about 71% of the Earth’s surface and are connected by currents and tides. Freshwater bodies of water are the lakes, rivers, streams, and ponds that contain low concentrations of dissolved salts and minerals. They cover about 1% of the Earth’s surface and are mainly fed by precipitation and runoff.

Physical features, landforms, and bodies of water are interrelated and interdependent. They affect and are affected by each other in various ways. For example, mountains can influence the climate and precipitation of a region, as well as the flow and direction of rivers. Rivers can carve out valleys and canyons, as well as deposit sediments and nutrients in deltas and lakes. Lakes can provide habitats for aquatic life, as well as sources of water for irrigation and drinking. Oceans can moderate the temperature and humidity of the land, as well as transport heat and moisture across the globe.

Physical features, landforms, and bodies of water are also important for human society and civilization. They provide natural resources, such as water, minerals, soil, and energy. They offer opportunities for recreation, tourism, and exploration. They pose challenges and hazards, such as floods, droughts, landslides, and earthquakes. They shape the history, culture, and identity of different peoples and nations. They inspire the imagination, creativity, and curiosity of human beings.

In conclusion, physical features, landforms, and bodies of water are the essential components of the Earth’s surface. They are the result of complex and dynamic processes that occur within and on the Earth. They are the basis of the natural environment and the human environment. They are the source of beauty and wonder, as well as of problems and solutions. They are the subject of study and discovery, as well as of appreciation and preservation. They are the physical features of our planet.

Physical Features Landforms And Bodies Of Water

World’s 86 Trillion Economy

The world economy is the sum of the economic activities of all countries and regions in the world. It measures the total output of goods and services, as well as the income and wealth of the people who produce and consume them. One of the most common ways to measure the size of the world economy is by using the gross domestic product (GDP) of each country or region, and adding them up to get the global GDP.

According to the latest data from the World Bank, the global GDP in 2018 was $85.8 trillion, which means that the value of all the goods and services produced in the world in that year was equivalent to $85.8 trillion. This was an increase of 6.9% from the previous year, when the global GDP was $80.2 trillion. However, this growth rate was lower than the average of 7.5% in the past decade, indicating a slowdown in the world economy.

The world economy is not evenly distributed among the countries and regions of the world. Some countries and regions have larger and more developed economies than others, and contribute more to the global GDP. The following table shows the top 15 economies in the world by nominal GDP in 2018, as well as their share of the global GDP:

| Rank | Country/Region | GDP (Nominal, USD) | Share of Global GDP (%) |
| 1 | United States | $20.49 trillion | 23.89 |
| 2 | China | $13.61 trillion | 15.86 |
| 3 | Japan | $4.97 trillion | 5.79 |
| 4 | Germany | $4.00 trillion | 4.66 |
| 5 | United Kingdom | $2.83 trillion | 3.29 |
| 6 | France | $2.78 trillion | 3.24 |
| 7 | India | $2.73 trillion | 3.18 |
| 8 | Italy | $2.07 trillion | 2.42 |
| 9 | Brazil | $1.87 trillion | 2.18 |
| 10 | Canada | $1.71 trillion | 1.99 |
| 11 | Russia | $1.66 trillion | 1.93 |
| 12 | South Korea | $1.62 trillion | 1.89 |
| 13 | Australia | $1.43 trillion | 1.67 |
| 14 | Spain | $1.43 trillion | 1.66 |
| 15 | Mexico | $1.22 trillion | 1.43 |

The above 15 economies accounted for 75% of the global GDP in 2018, which means that the remaining 25% was shared by the other 180 countries and regions in the world. The largest economy in the world was the United States, with a GDP of $20.49 trillion, or 23.89% of the global GDP. The second largest economy was China, with a GDP of $13.61 trillion, or 15.86% of the global GDP. The gap between the two economies was narrowing, as China’s GDP grew faster than the United States’ GDP in 2018.

The world economy can also be divided into different regions, based on the geographic location and the economic characteristics of the countries and regions within them. The following table shows the GDP of the seven major regions in the world in 2018, as well as their share of the global GDP:

| Rank | Region | GDP (Nominal, USD) | Share of Global GDP (%) |
| 1 | East Asia and Pacific | $25.9 trillion | 30.2 |
| 2 | Europe and Central Asia | $23.0 trillion | 26.8 |
| 3 | North America | $22.2 trillion | 25.9 |
| 4 | Latin America and Caribbean | $5.8 trillion | 6.8 |
| 5 | Middle East and North Africa | $3.6 trillion | 4.2 |
| 6 | South Asia | $3.5 trillion | 4.1 |
| 7 | Sub-Saharan Africa | $1.7 trillion | 2.0 |

The largest region in the world by GDP was East Asia and Pacific, with a GDP of $25.9 trillion, or 30.2% of the global GDP. This region included China, Japan, South Korea, Australia, and other countries and territories in Asia and Oceania. The second largest region was Europe and Central Asia, with a GDP of $23.0 trillion, or 26.8% of the global GDP. This region included Germany, France, United Kingdom, Italy, Russia, and other countries and territories in Europe and Central Asia. The third largest region was North America, with a GDP of $22.2 trillion, or 25.9% of the global GDP. This region included the United States, Canada, and Mexico.

The world economy can also be classified into different income levels, based on the average income per person of the countries and regions in the world. The World Bank uses four income categories: high income, upper middle income, lower middle income, and low income. The following table shows the GDP of the four income groups in the world in 2018, as well as their share of the global GDP:

| Income Group | GDP (Nominal, USD) | Share of Global GDP (%) |
| High income | $54.1 trillion | 63.1 |
| Upper middle income | $24.4 trillion | 28.4 |
| Lower middle income | $6.7 trillion | 7.8 |
| Low income | $0.6 trillion | 0.7 |

The largest income group in the world by GDP was the high income group, with a GDP of $54.1 trillion, or 63.1% of the global GDP. This group included the United States, Japan, Germany, France, United Kingdom, Canada, Australia, and other countries and regions with a gross national income (GNI) per capita of $12,376 or more in 2018. The smallest income group was the low income group, with a GDP of $0.6 trillion, or 0.7% of the global GDP. This group included Afghanistan, Haiti, Ethiopia, Malawi, and other countries and regions with a GNI per capita of $1,025 or less in 2018.

The world economy is constantly changing and evolving, as a result of various factors, such as population growth, technological innovation, trade and investment, political and social events, and environmental issues. Some of the current trends and challenges that affect the world economy are:

– The impact of the COVID-19 pandemic, which has caused a global health crisis and an unprecedented economic shock, disrupting production, consumption, trade, and travel, and threatening millions of lives and livelihoods.
– The rise of China and other emerging economies, which have increased their economic power and influence, and challenged the dominance of the United States and other advanced economies, creating new opportunities and tensions in the global economic order.
– The shift to a digital and knowledge-based economy, which has transformed the nature and structure of economic activities, and created new sources of growth and innovation, as well as new risks and inequalities.
– The need for a green and sustainable economy, which can address the urgent problems of climate change, environmental degradation, and resource depletion, and ensure the well-being of the present and future generations.

The world economy is a complex and dynamic system, that reflects the interactions and interdependencies of billions of people and millions of organizations across the globe. It is a source of wealth and welfare, as well as of conflict and crisis. It is a subject of study and analysis, as well as of policy and action. It is the world economy.

World's 86 Trillion Economy

World Explorer Map

A world map is a graphical representation of the Earth’s surface on a flat plane, showing the locations and shapes of continents, oceans, islands, countries, and other features. World maps can have different purposes and perspectives, such as showing political boundaries, physical landscapes, climate zones, population distribution, or historical events. World maps can also use different projections, which are methods of transforming the curved surface of the Earth into a flat map, with varying degrees of distortion and accuracy.

To read a world map, one needs to understand its basic components and how they relate to the real world. Some of the common components of a world map are:

– Title: The title tells the reader what the map is about and what kind of information it shows. For example, a map titled “World Population Density” would show how many people live in each area of the world, while a map titled “World War II” would show the major events and territories involved in the war.
– Legend: The legend, also called a key, explains the meaning of the symbols, colors, and labels used on the map. For example, a legend might show that a red dot represents a capital city, a blue line represents a river, and a green area represents a forest. The legend helps the reader to interpret the map and find the information they need.
– Scale: The scale shows the relationship between the distance on the map and the distance on the ground. For example, a scale might show that one centimeter on the map equals 100 kilometers on the ground. The scale helps the reader to measure the size and distance of the features on the map and compare them to the real world.
– Orientation: The orientation shows the direction of the map and how it corresponds to the cardinal directions of north, south, east, and west. Most maps have north at the top, but some maps may have a different orientation depending on the projection or the perspective. The orientation helps the reader to locate the features on the map and navigate the world.
– Projection: The projection is the method of transforming the curved surface of the Earth into a flat map. There are many types of projections, each with its own advantages and disadvantages. Some of the common projections are:

  – Mercator projection: This projection preserves the shape and direction of the features on the map, but distorts the size and area, especially near the poles. This projection is useful for navigation and showing angles and directions, but not for showing the relative size and area of the regions.
  – Robinson projection: This projection balances the shape, size, and area of the features on the map, but distorts the edges and corners. This projection is useful for showing the general appearance and distribution of the regions, but not for showing the exact shape and size of the features.
  – Winkel tripel projection: This projection minimizes the distortion of the shape, size, and area of the features on the map, but still has some errors and irregularities. This projection is useful for showing the overall accuracy and realism of the world, but not for showing the precise details and measurements of the features.

To read a world map effectively, one needs to consider the purpose, perspective, and projection of the map, and use the components of the map to find and understand the information they need. World maps are powerful tools for learning and communicating about the world, but they are also limited and subjective representations of the complex and dynamic reality of the Earth. Therefore, one should always be critical and curious when reading a world map, and compare and contrast different maps to gain a deeper and broader understanding of the world.

World Explorer Map

World Population Projections & Age Profile

World population projections are estimates of the future size, growth, and distribution of the human population, based on assumptions about fertility, mortality, and migration. World population projections are useful for understanding the past, present, and future trends of the population, as well as for planning and policymaking in various fields, such as health, education, environment, and development.

One of the main sources of world population projections is the United Nations, which publishes the World Population Prospects every two years. The latest edition, the 2022 revision, presents population estimates from 1950 to 2021, and population projections from 2021 to 2100, for 237 countries and regions, and for the world as a whole. The projections are based on three scenarios: low, medium, and high fertility, which reflect different assumptions about the future levels and trends of fertility in each country and region.

According to the medium-fertility scenario, which is the most widely used and cited, the world population is projected to increase from 7.9 billion in 2021 to 9.7 billion in 2050, and to 10.9 billion in 2100. This means that the world population will grow by 22% between 2021 and 2050, and by 38% between 2021 and 2100. However, the growth rate of the world population will slow down over time, from 1.0% per year in 2021-2025, to 0.5% per year in 2045-2050, and to 0.1% per year in 2095-2100.

The world population growth will also vary by region and by country. Some regions and countries will experience faster or slower growth, or even decline, depending on their fertility, mortality, and migration patterns. The following table shows the projected population size and growth rate of the major regions of the world in 2021, 2050, and 2100, according to the medium-fertility scenario:

| Region | Population (millions) | Growth rate (% per year) |
| | 2021 | 2050 | 2100 | 2021-2050 | 2050-2100 |
| World | 7,874 | 9,735 | 10,875 | 0.8 | 0.3 |
| Africa | 1,373 | 2,489 | 3,775 | 2.5 | 1.3 |
| Asia | 4,678 | 5,267 | 5,096 | 0.4 | -0.1 |
| Europe | 748 | 710 | 603 | -0.2 | -0.5 |
| Latin America and the Caribbean | 653 | 769 | 768 | 0.6 | 0.0 |
| Northern America | 368 | 435 | 500 | 0.6 | 0.4 |
| Oceania | 43 | 66 | 83 | 1.5 | 0.7 |

The table shows that Africa will be the fastest-growing region in the world, with its population more than doubling by 2050, and nearly tripling by 2100. Asia will remain the largest region in the world, but its population will peak around 2050, and then decline slightly by 2100. Europe will be the only region to experience a population decline by 2050, and will continue to shrink by 2100. Latin America and the Caribbean will have a moderate population growth by 2050, but will stabilize by 2100. Northern America and Oceania will have a steady population growth throughout the century.

The table also shows that the world population will become more concentrated in Africa and Asia, which will account for 86% of the world population by 2100, up from 77% in 2021. Europe and Latin America and the Caribbean will see their shares of the world population decline, from 10% and 8% in 2021, to 6% and 7% in 2100, respectively. Northern America and Oceania will maintain their shares of the world population, at 5% and 1%, respectively.

World population projections also provide information about the age structure and composition of the population, which are important indicators of the demographic and social characteristics of a population. The age structure of a population refers to the distribution of the population by age groups, such as children, working-age adults, and elderly. The age composition of a population refers to the proportion of the population in each age group, such as the child dependency ratio, the old-age dependency ratio, and the median age.

The age structure and composition of the world population will change significantly over time, as a result of the changes in fertility, mortality, and migration. The following table shows the projected age composition of the world population in 2021, 2050, and 2100, according to the medium-fertility scenario:

| Age group | Population (millions) | Proportion (%) |
| | 2021 | 2050 | 2100 | 2021 | 2050 | 2100 |
| 0-14 | 1,907 | 2,015 | 2,015 | 24.2 | 20.7 | 18.5 |
| 15-64 | 5,270 | 6,125 | 6,303 | 66.9 | 62.9 | 57.9 |
| 65+ | 697 | 1,595 | 2,557 | 8.9 | 16.4 | 23.5 |
| Child dependency ratio | 36.2 | 32.9 | 32.0 | | | |
| Old-age dependency ratio | 13.2 | 26.0 | 40.6 | | | |
| Median age | 31.0 | 36.6 | 42.6 | | | |

The table shows that the world population will age over time, as the proportion of children will decline, and the proportion of elderly will increase. The child dependency ratio, which measures the number of children under 15 per 100 working-age adults, will decrease from 36.2 in 2021, to 32.9 in 2050, and to 32.0 in 2100. The old-age dependency ratio, which measures the number of elderly over 65 per 100 working-age adults, will increase from 13.2 in 2021, to 26.0 in 2050, and to 40.6 in 2100. The median age, which measures the age at which half of the population is older and half is younger, will increase from 31.0 in 2021, to 36.6 in 2050, and to 42.6 in 2100.

The aging of the world population will have various implications for the social and economic development of the world, such as the demand for health care, pensions, and social services, the supply of labor and human capital, and the potential for innovation and productivity. The aging of the world population will also vary by region and by country, depending on their demographic trajectories and policies. Some regions and countries will face more challenges and opportunities than others, as they cope with the changing age structure and composition of their populations.

In conclusion, world population projections are valuable tools for understanding and anticipating the future of the human population, as well as for informing and guiding the actions and decisions of various stakeholders, such as governments, international organizations, civil society, and individuals. World population projections are based on assumptions and uncertainties, and are subject to revisions and updates, as new data and information become available. World population projections are not predictions or forecasts, but scenarios and possibilities, that reflect the potential outcomes of the demographic trends and transitions of the world population.

World Population Projections & Age Profile

World Regions

World regions are ways of grouping countries or territories based on their geographical, cultural, historical, or political characteristics. There is no definitive or universally agreed-upon classification of world regions, as different organizations or disciplines may use different criteria or methods to divide the world. However, some common ways of defining world regions are based on continents, United Nations geoscheme, World Bank regional classification, or cultural and linguistic similarities.

One of the simplest ways of defining world regions is based on the six inhabited continents: Africa, Asia, Europe, North America, South America, and Oceania. However, this method has some limitations, as some continents are very diverse and heterogeneous, such as Asia and Africa, while others are very small and isolated, such as Oceania. Moreover, some continents are not clearly separated by natural boundaries, such as Europe and Asia, which are sometimes considered as a single continent of Eurasia.

Another way of defining world regions is based on the United Nations geoscheme, which divides the world into six continental regions, 22 geographical subregions, and two intermediary regions. This method was devised by the United Nations Statistics Division (UNSD) based on the M49 coding classification, which assigns numerical codes to countries and territories for statistical purposes. The UNSD geoscheme is not based on political or cultural affiliation, but rather on geographical proximity and similarity. For example, the UNSD geoscheme includes Cyprus and Georgia in Western Asia, even though they are culturally and politically closer to Europe. The six continental regions of the UNSD geoscheme are Africa, Americas, Asia, Europe, Oceania, and Antarctica.

A third way of defining world regions is based on the World Bank regional classification, which groups countries and territories according to their income level and geographical location. The World Bank regional classification is mainly used for economic and development analysis and policy making. The World Bank regional classification consists of eight regions: East Asia and Pacific, Europe and Central Asia, Latin America and Caribbean, Middle East and North Africa, North America, South Asia, Sub-Saharan Africa, and High-income OECD members.

A fourth way of defining world regions is based on cultural and linguistic similarities, which may reflect historical ties, religious beliefs, ethnic identities, or shared values. This method is more subjective and flexible, as different criteria or perspectives may lead to different groupings. For example, some cultural and linguistic regions are the Arab world, the Francophone world, the Anglophone world, the Hispanic world, the Slavic world, the Nordic countries, the Balkans, the Commonwealth of Independent States, and the European Union.

In conclusion, world regions are useful ways of organizing and understanding the diversity and complexity of the world. However, there is no single or definitive way of defining world regions, as different methods may have different advantages and disadvantages, depending on the purpose and context of the analysis. Therefore, it is important to be aware of the criteria and assumptions behind each method, and to recognize the diversity and dynamism within and across world regions.

World Regions

Gdp Composition By Sector

GDP composition by sector is a way of measuring the contribution of different economic sectors to the total gross domestic product (GDP) of a country or region. GDP is the monetary value of all the final goods and services produced within a given period of time. Economic sectors are broad categories of economic activities that share common characteristics, such as agriculture, industry, and services.

The most common way of dividing the economy into sectors is based on the three-sector theory, which distinguishes between primary, secondary, and tertiary sectors. The primary sector includes activities that directly extract or harvest natural resources, such as agriculture, forestry, fishing, and mining. The secondary sector includes activities that transform raw materials into finished or semi-finished products, such as manufacturing, construction, and utilities. The tertiary sector includes activities that provide services to consumers or other businesses, such as trade, transport, communication, education, health, finance, and government.

The GDP composition by sector can vary significantly across countries and regions, depending on their level of development, natural endowments, economic policies, and historical factors. Generally, less developed countries tend to have a larger share of GDP from the primary sector, while more developed countries tend to have a larger share of GDP from the tertiary sector. The secondary sector usually peaks at an intermediate stage of development, as countries undergo industrialization and urbanization. However, there are also exceptions and variations to this pattern, as some countries may specialize in certain sectors due to comparative advantages or strategic choices.

The GDP composition by sector can also change over time, as countries experience structural transformation, which is the process of shifting the allocation of resources and output from one sector to another. Structural transformation is often driven by changes in technology, productivity, demand, trade, and institutions, which affect the relative profitability and competitiveness of different sectors. Structural transformation can have significant implications for economic growth, employment, income distribution, and environmental sustainability.

The following table shows the GDP composition by sector for some selected countries and regions, based on the nominal GDP data from the World Bank for the year 2023. The table also shows the real GDP data from the International Monetary Fund for the year 2017, which are adjusted for price differences and inflation. The table illustrates the diversity and dynamics of the GDP composition by sector across the world.

| Country/Region | Nominal GDP (USD$) | Primary (%) | Secondary (%) | Tertiary (%) | Real GDP (US$MM) | Primary (%) | Secondary (%) | Tertiary (%) |
| World          | 104,480            | 5.9         | 30.5          | 63.6        | 127,800,000      | 6.4         | 30.0          | 63.6        |
| China          | 17,700             | 6.9         | 40.1          | 52.9        | 23,210,000       | 7.9         | 40.5          | 51.6        |
| USA            | 26,950             | 1.12        | 19.1          | 79.7        | 19,490,000       | 0.9         | 19.1          | 80.0        |
| India          | 3,730              | 17.4        | 25.8          | 56.9        | 9,474,000        | 15.4        | 23.0          | 61.6        |
| Japan          | 4,230              | 1.2         | 27.5          | 71.4        | 5,443,000        | 1.2         | 27.8          | 71.0        |
| Canada         | 2,120              | 1.8         | 28.6          | 69.6        | 1,847,000        | 1.6         | 28.2          | 70.2        |

Gdp Composition By Sector