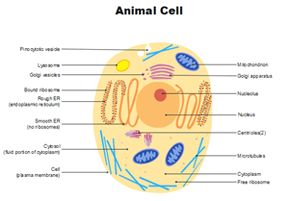
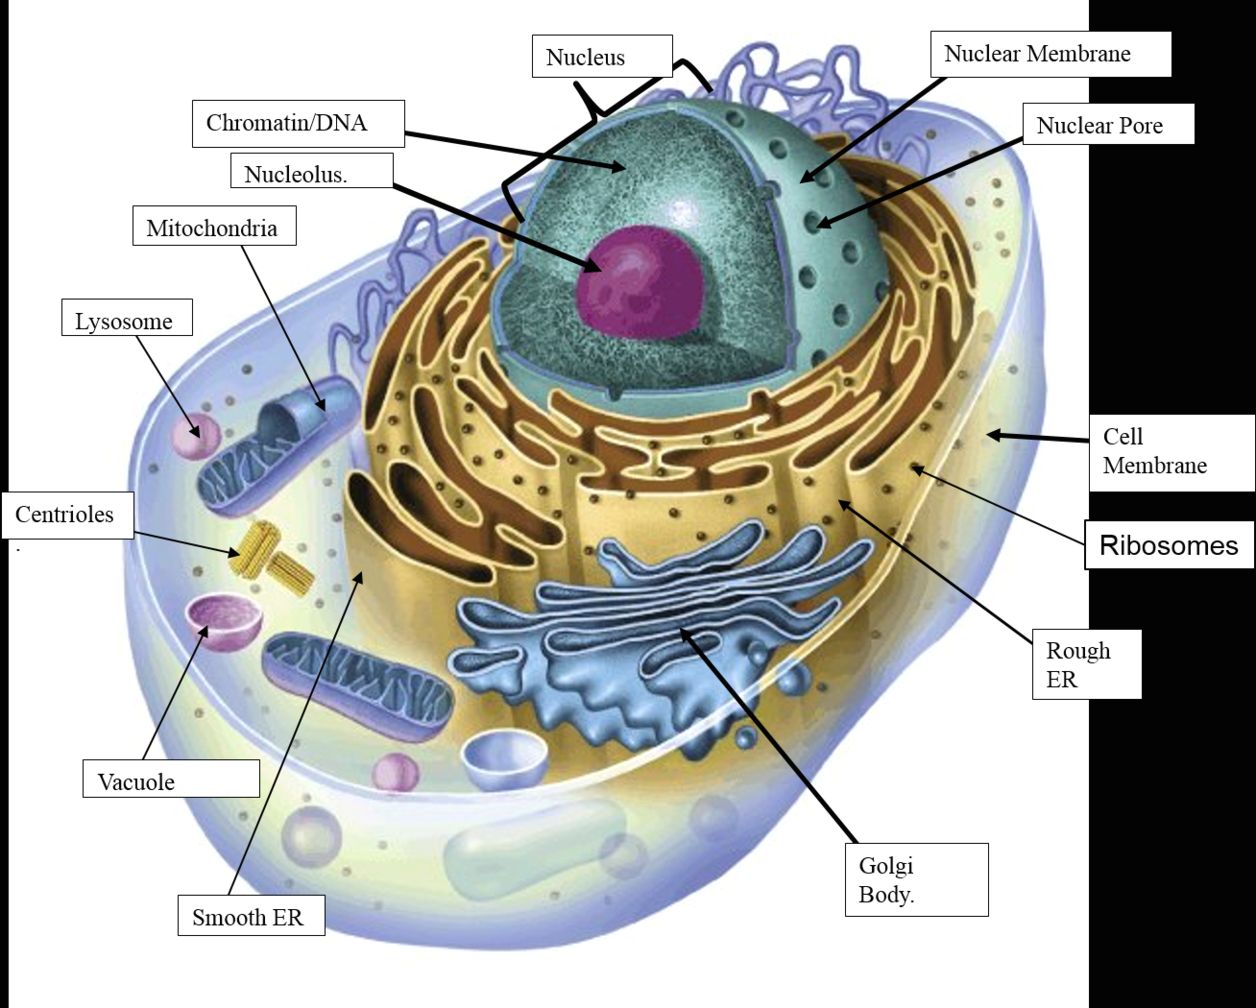
See the below image for the Animal cell structure diagram.
Your Graphs, Charts and Diagrams
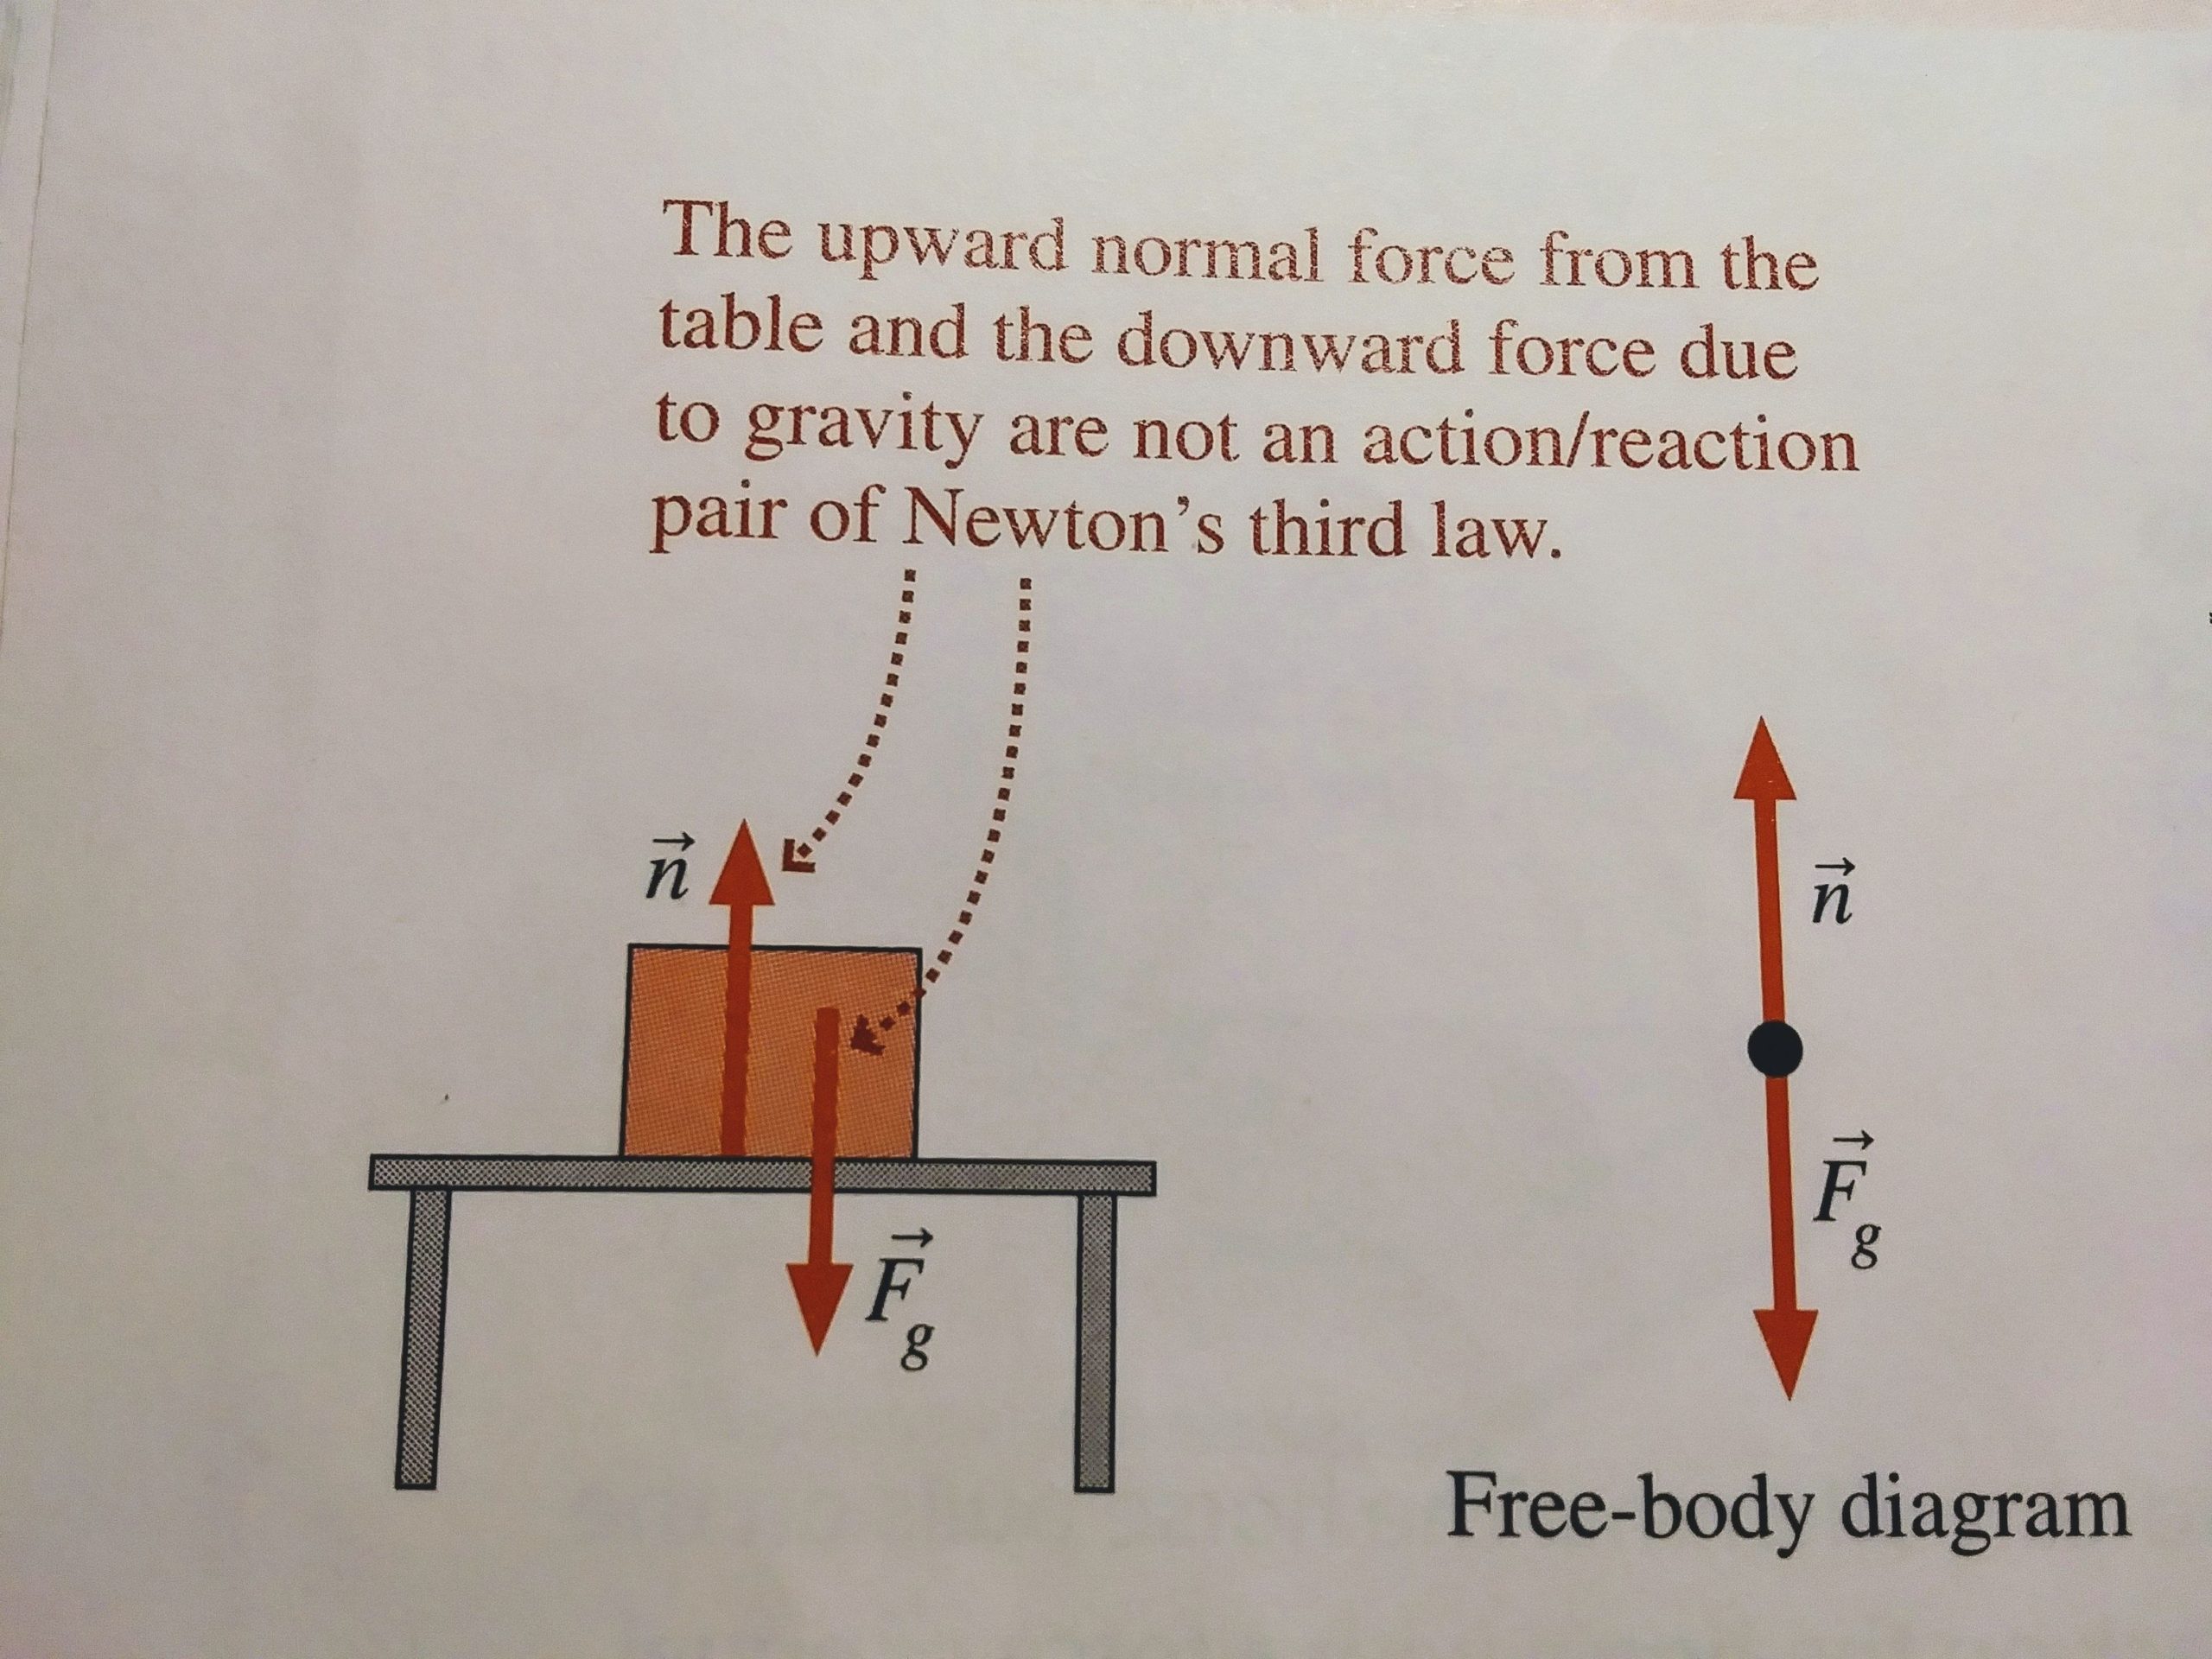
See the below image for the Newtons third law diagram. Newton’s third law. The third law states that all forces between two objects exist in equal magnitude and opposite direction: if one object A exerts a force FA on a second object B, then B simultaneously exerts a force FB on A, and the two forces are equal in magnitude and opposite in direction: FA = − FB.
Newton’s Third Law. The size of the forces on the first object equals the size of the force on the second object. The direction of the force on the first object is opposite to the direction of the force on the second object. Forces always come in pairs – equal and opposite action-reaction force pairs.
Newton’s laws of motion are three laws of classical mechanics that describe the relationship between the motion of an object and the forces acting on it. These laws can be paraphrased as follows: Law 1. A body continues in its state of rest, or in uniform motion in a straight line, unless acted upon by a force.
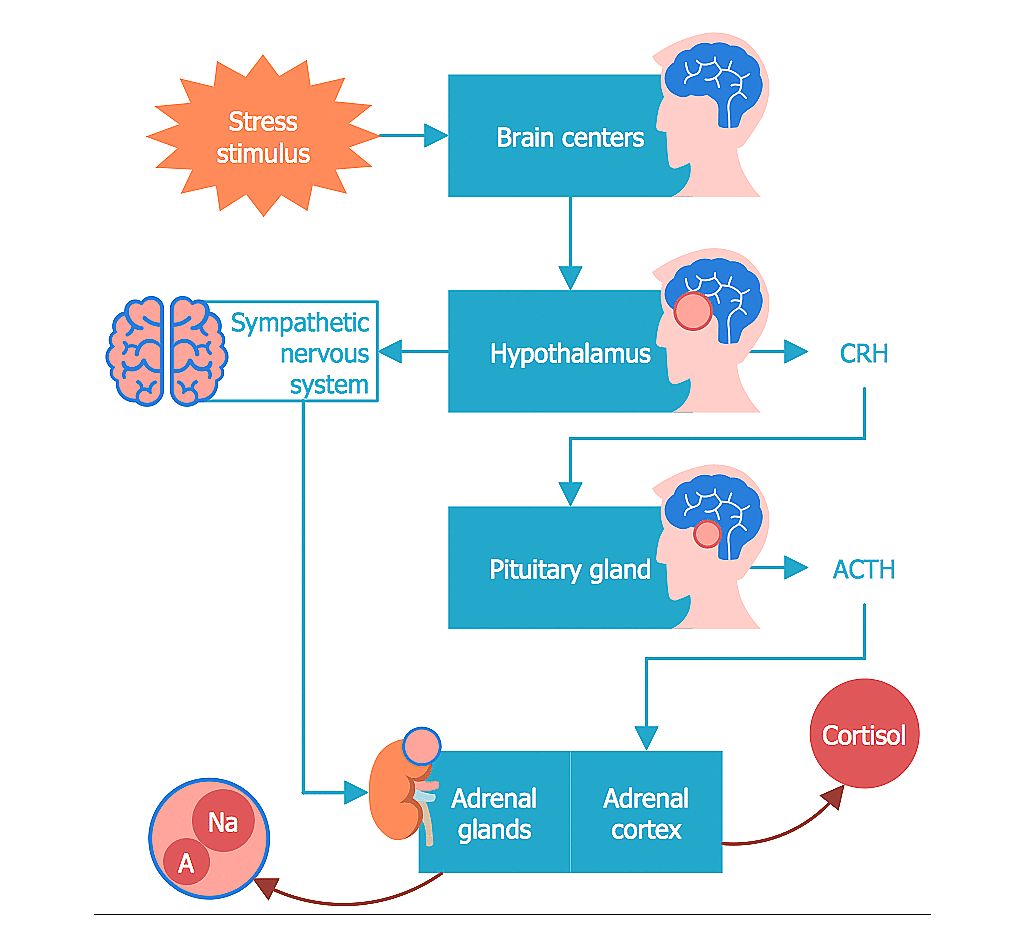
See the below image for the Stress and nervous system explained diagram. This causes increased heart rate, blood pressure rises, and our bodies experience all of the intense physiological symptoms of stress. These two parts of the nervous system are the cornerstones of the stress response in the body and mind. The sympathetic nervous system tells us to go” and aids in the fight or flight” response.
How Stress and the Nervous System Are Linked When we are confronted with a stressful experience, the amygdala part of the brain sends a distress signal to the hypothalamus, which activates the nervous system and adrenal glands. These glands respond by pumping adrenaline into the bloodstream.
Our sympathetic nervous system has a direct role in our physical response to stress and generates what is known as our fight or flight response. This is a natural evolutionary response that was designed to protect us from danger by encouraging us to flee the danger or fight – fight or flight.
See the below image for the Plant and animal cell diagram. Animal cells do not have a cell wall. When looking under a microscope, the cell wall is an easy way to distinguish plant cells. Plants are autotrophs; they produce energy from sunlight through the process of photosynthesis, for which they use cell organelles called chloroplasts. Animal cells do not have chloroplasts.
[In this figure] The cell anatomy of animal and plant cells. The animal cell and plant cell share many organelles in common, such as a nucleus, ER, cytosol, lysosomes, Golgi apparatus, cell membrane, and ribosomes. The organelles unique for plant cells are vacuole, cell wall, and chloroplast (shown in orange text).Animal cells have one or more small vacuoles, whereas plant cells have one large central vacuole that can take up to 90% of the cell volume. The function of vacuoles in plants is to store water and maintain the turgidity of the cell.
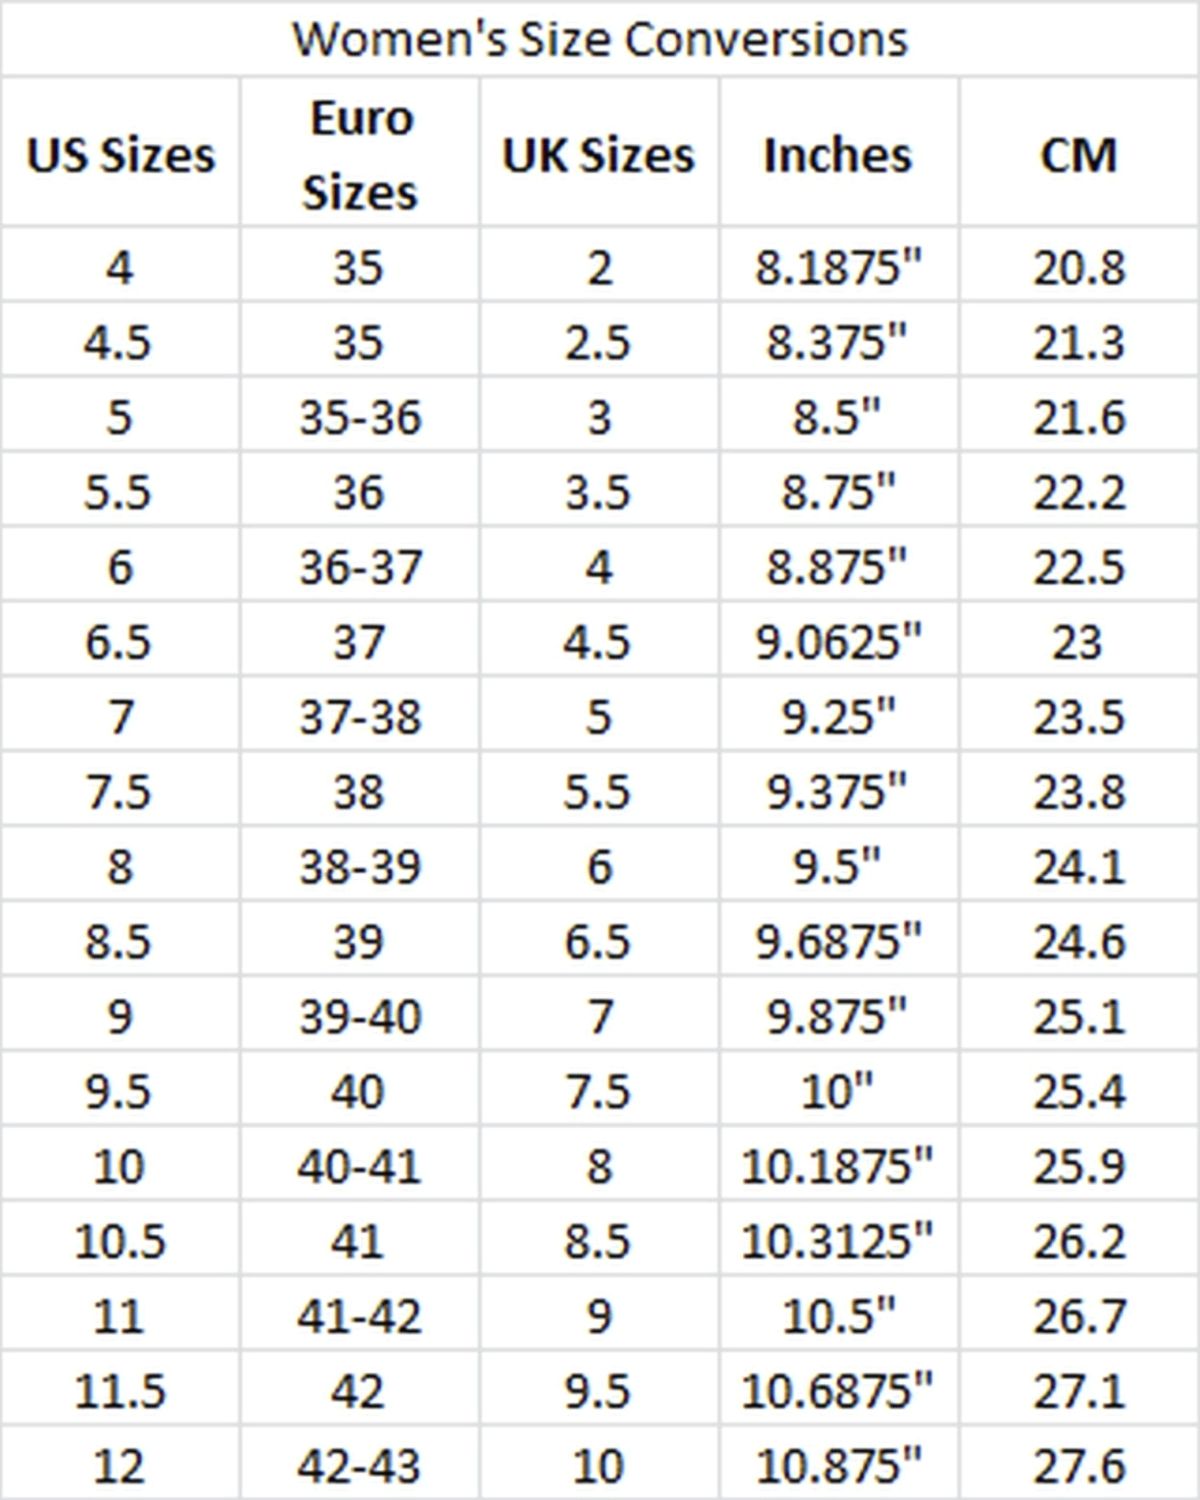
See the below image for the Women size conversion diagram. Women’s dresses, clothing, blouses, shirts and sweater’s size conversion charts between American (US), Canadian, European, British (UK), Australian, Italian, French and Japanese sizes. There are two charts (women’s and junior’s) for women’s dress sizes since United States use different numbering system (even vs odd) for each category.
Please note that there is no real international standard for women’s clothing sizes. You should use these charts for approximation only and it’s always a good idea to contact to the manufacturer for accurate clothing sizes to avoid surprises.
Women’s Sizes: Quick and Easy Women’s sizes are far more diverse than that for men and children. To determine a woman’s clothing size, you need to take measurements of the following body parts or areas: (1) chest, (2) waist, (3) first hip or low waist, (4) hips or second hip, (5) and height.
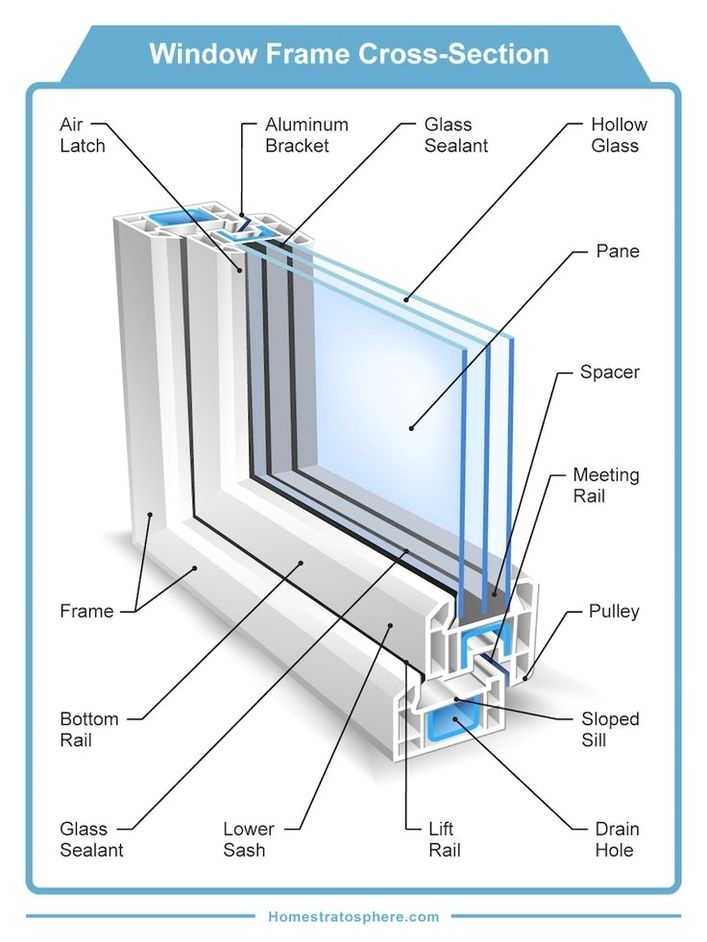
See the below image for the Parts of a window and window frame diagram. Window terminology can be divided into a few categories, such as the parts of the window frame, the glass itself, and the various safety and security features. Let’s start by taking a look at the parts of a window’s frame: Window Frame – A window frame holds and supports the entire window within the wall.
Inside the window frame is a piece of glass to keep the elements out and the cool/warm air in. This part of the window is located at the top of the frame and is horizontal. The vertical part of the window create the window frame’s sides.
Sill – The lowest part of the window frame. Head – The highest part of the window frame. Jamb – The vertical sides of the window frame. Apron – A piece of decorative trim installed beneath the railing or sill.
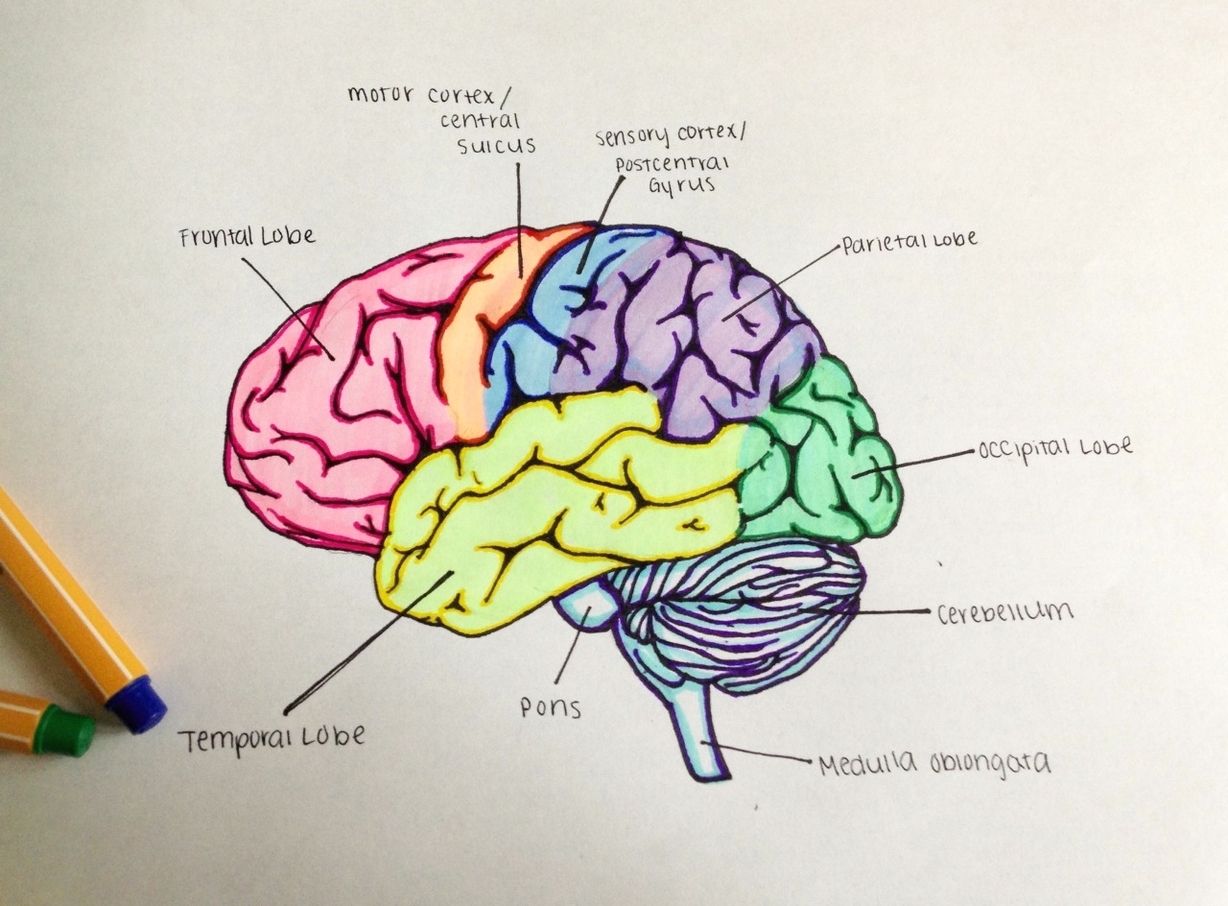
See the below image for the Psychology neuroscience lobes of the brain diagram. Lobes of the Brain. The four lobes of the brain are the frontal, parietal, temporal, and occipital lobes (Figure 2). The frontal lobe is located in the forward part of the brain, extending back to a fissure known as the central sulcus.
The frontal lobe is located in the forward part of the brain, extending back to a fissure known as the central sulcus. The frontal lobe is involved in reasoning, motor control, emotion, and language. It contains the motor cortex, which is involved in planning and coordinating movement; the prefrontal cortex,…
Deep within the lateral sulcus (Sylvian fissure) is the fifth lobe of the brain, the insular lobe. This lobe is not clearly visible from the outside, but can be viewed when the temporal lobe is retracted from the cortex. The parts of the frontal, parietal and temporal lobes that overlie the insula are known as the opercula .
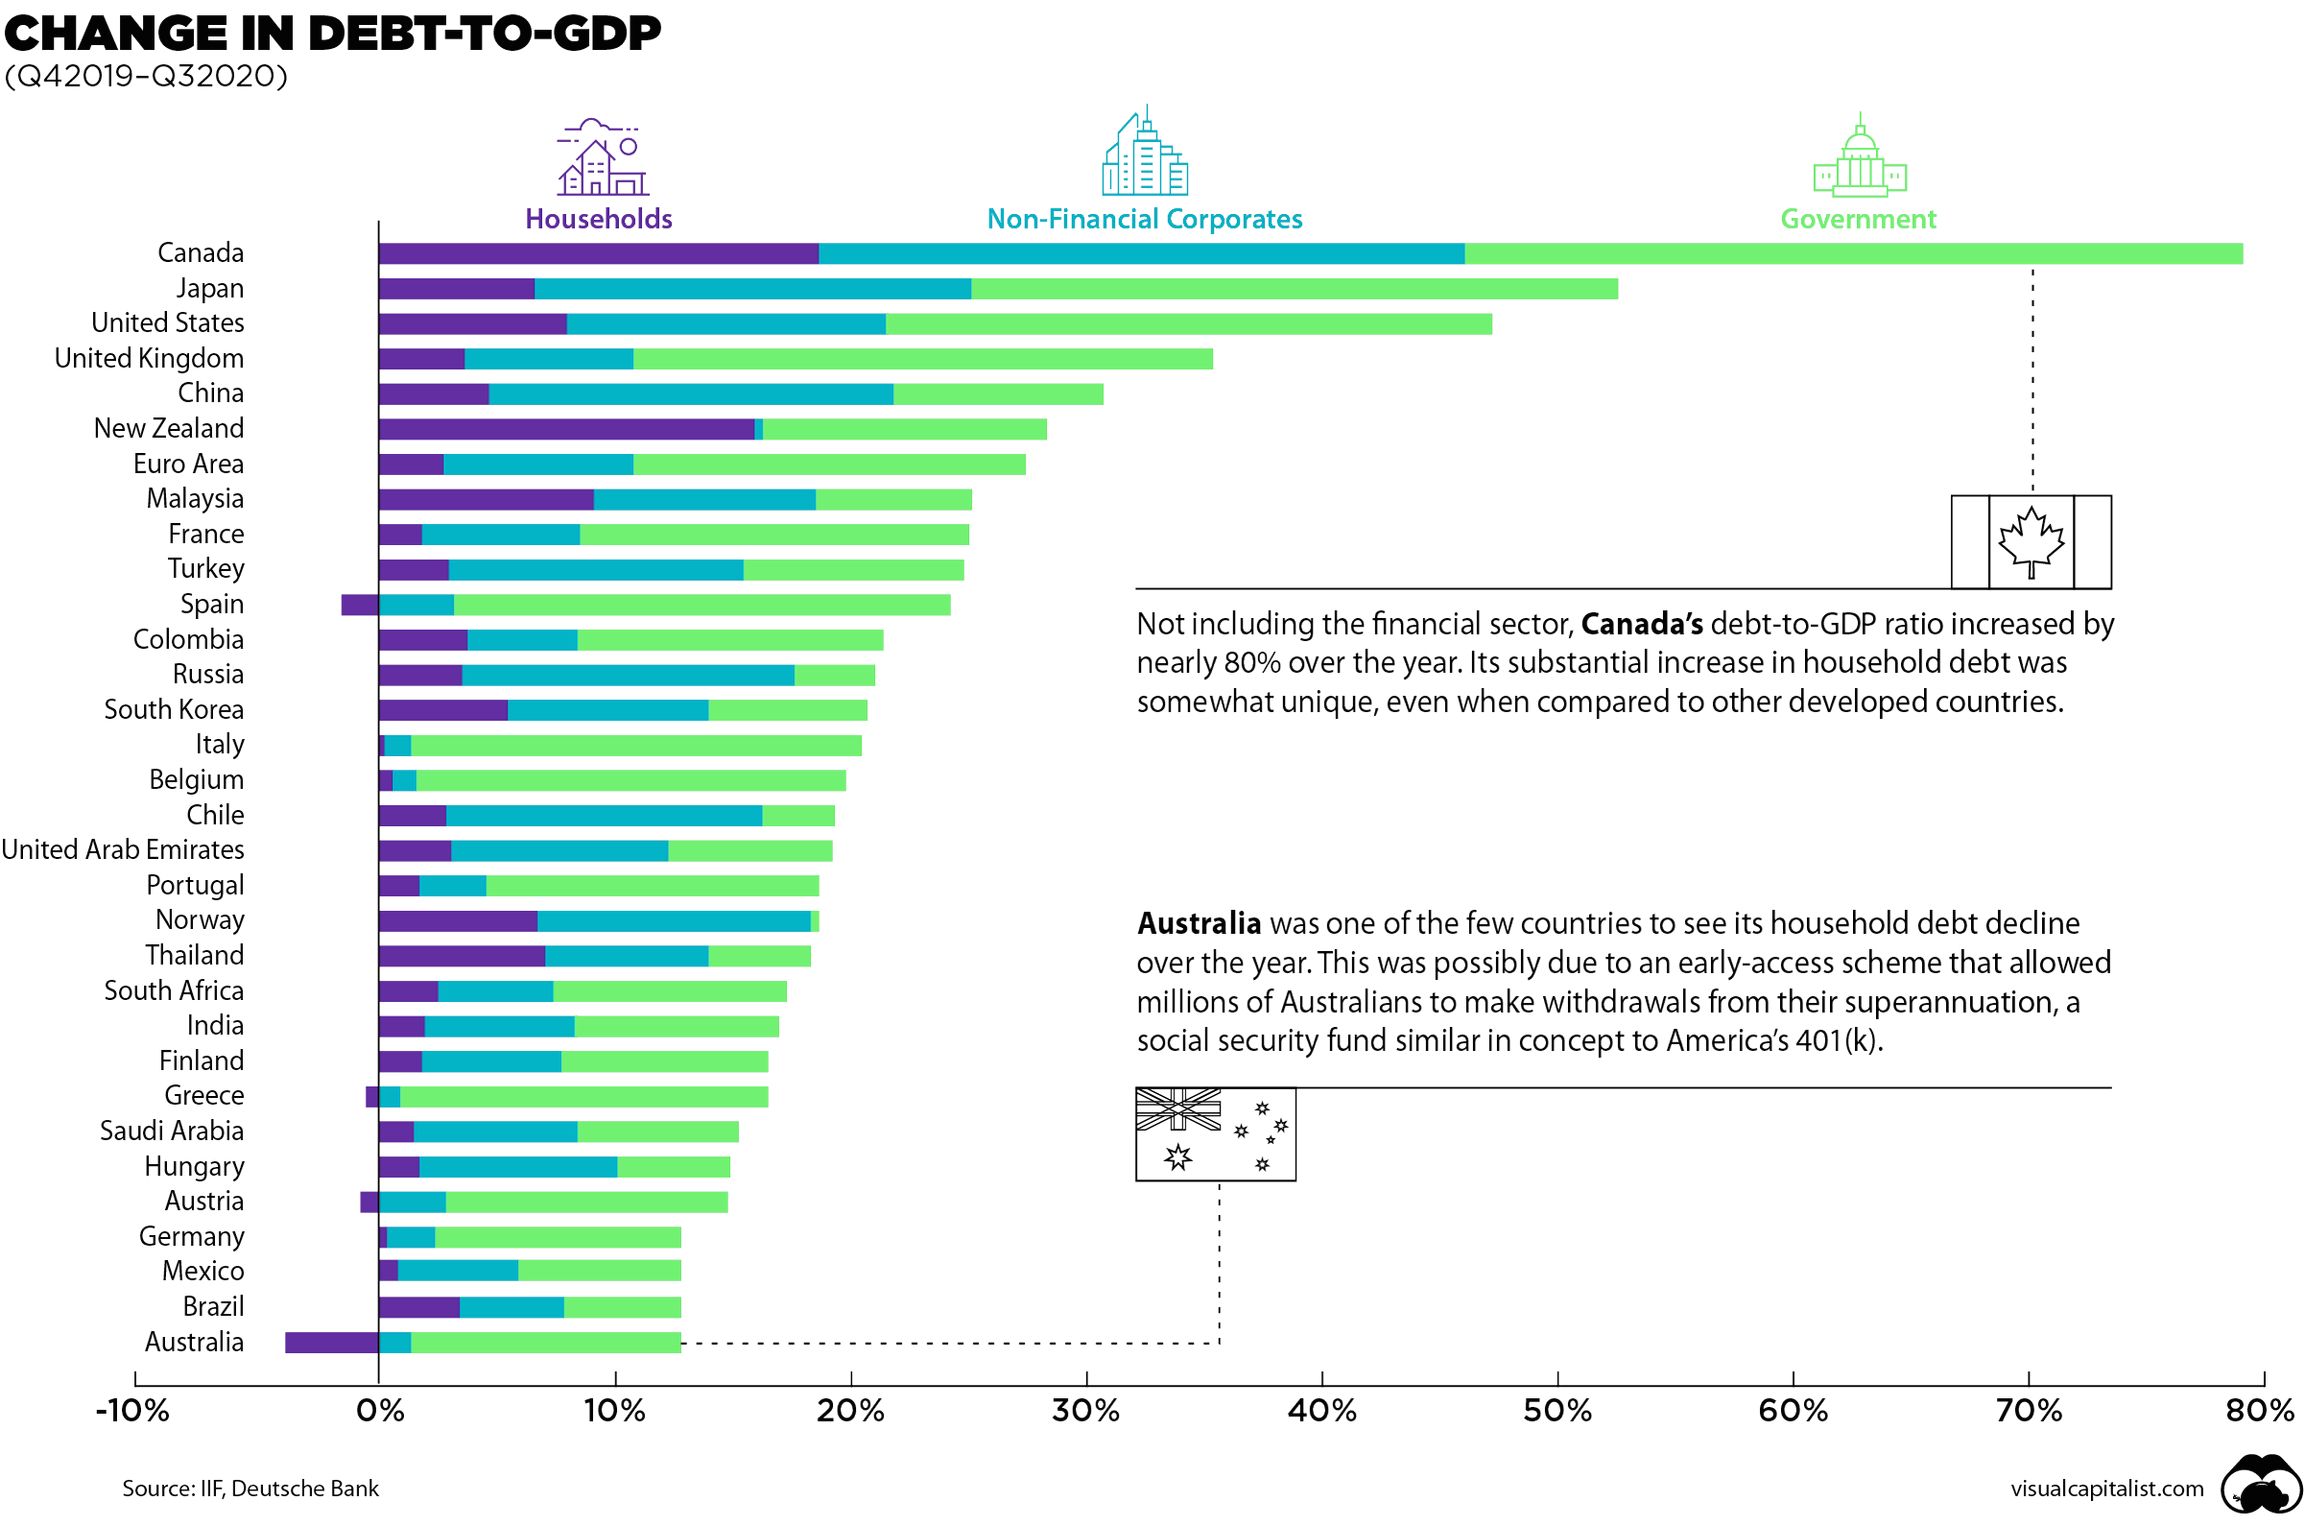
See the below image for the Debt to gdp globally diagram. As countries were hit by the pandemic, global debt rose to $226 trillion, or 256 percent of GDP in 2020. Borrowing by governments accounted for slightly more than half of this increase, as global public debt jumped by 20 percent.
Debt to GDP Ratio by Country 2021 Name National Debt to GDP Ratio Population Japan 237.54% 126,050,804 Venezuela 214.45% 28,704,954 Sudan 177.87% Greece 174.15% 10,370,744 71 more rows …
The higher the debt-to-GDP ratio, the less likely the country will pay back its debt and the higher its risk of default. A study by the World Bank found that if the debt-to-GDP ratio of a country exceeds 77% for an extended period of time, it slows economic growth.
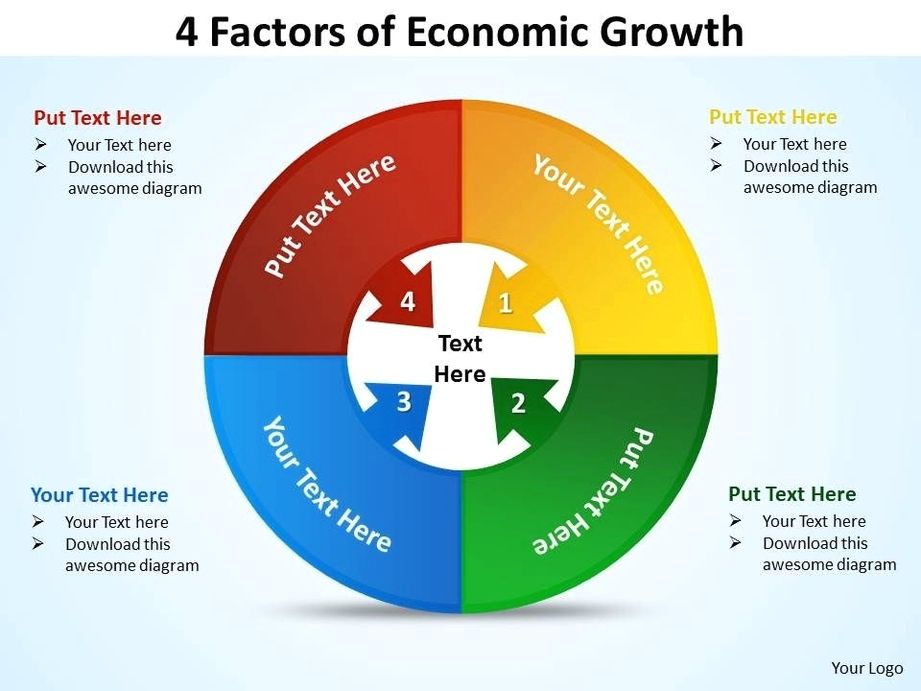
See the below image for the 4 factors of economic growth diagram. Natural Resources, Human Capital, Capital Goods, & Entrepreneurship • There are 4 factors of production that influence economic growth within a country: 1. Natural Resources available 2. Investment in Human Capital 3. Investment in Capital Goods 4.
Supply of Land and Other Natural Resources 2. Capital Formation 3. Human Capital 4. Technological Progress and Economic Growth. Factor # 1. Supply of Land and Other Natural Resources: The quantity and quality of natural resources play a vital role in the economic development of a country.
For example, in a given year, the telecommunication sector of a country marked a significant contribution to economic growth, while the mining sector did not perform well in terms of the country’s economic growth. Following are some of the important factors that affect the economic growth of a country:
