Rock Cycle Diagram

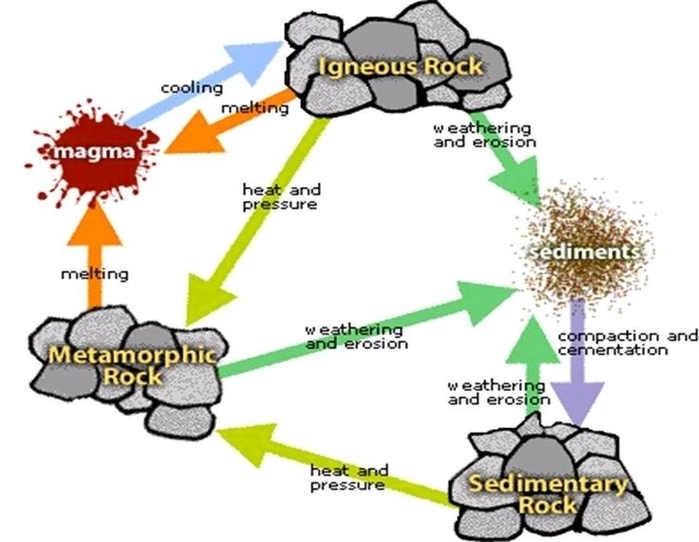
Rock Cycle Diagram. Rocks are broadly classified into three groups: igneous, sedimentary and metamorphic, and the simplest diagram of the “rock cycle” puts these three groups in a circle with arrows pointing from “igneous” to “sedimentary,” from “sedimentary” to “metamorphic,” and from “metamorphic” to “igneous” again.

This rock cycle diagram will show an upper level view of the process in which these types of rocks will be created. The rock cycle process flow is not necessarily an ordered set of steps.

Steps of the Rock Cycle: How does it Work 1) Formation of Igneous Rock – Melting, Cooling, and Crystallization Magma, the molten rock present deep inside the earth, solidifies due to cooling and crystallizes to form a type of rock called igneous rocks.

Rock Cycle Diagram

Scientific Method Diagram

Scientific diagrams are not intended to be ‘real life’ drawings, so you don’t need to be a great artist to create them. You do, however, need to follow several rules when drawing them. Use a sharp lead pencil. Don’t use a pen. Don’t use a coloured pencil. Don’t use a blunt pencil. Draw objects in two dimensions. Don’t draw in 3D.

Scientific Method Diagram Printout Write an outline of your scientific experiment. A scientific method graphic organizer including: State the problem, Gather information, Formulate a hypothesis, Test the hypotheses, Draw conclusions (either the results support the hypothesis or the results do not support the hypothesis).

A scientific method graphic organizer including: State the problem, Gather information, Formulate a hypothesis, Test the hypotheses, Draw conclusions (either the results support the hypothesis or the results do not support the hypothesis).

Scientific Method Diagram

Photosynthesis in Plants

Photosynthesis in plants is an extremely useful process whereby green plants take up carbon dioxide (a toxin) from the air and produce rich oxygen. Green plants are the only living thing on earth that are capable of converting the sun’s energy into food.

Photosynthesis in higher plants involves additional processes, but fundamentally it remains the same. It is a physicochemical process that uses sunlight for the synthesis of organic compounds. In this process, oxygen is released in the atmosphere. Photosynthesis occurs in the chloroplast, found in the mesophyll cells of the leaves.

DEFINITION OF PHOTOSYNTHESIS • Is the process by which autotrophic organisms use light energy to make sugar and oxygen gas from carbon dioxide and water. • Occurs in plants, algae and some prokaryotes • Anabolic (small molecules combined) • Endergonic (stores energy) • Stored as carbohydrate in their bodies. 4.

Photosynthesis in Plants

Filtration Diagram

Filter Process Diagram is a unique funnel infographics template that shows the screening process. The filtering process is a widely used concept in business presentations. Whether it is an HR presentation talking about the recruitment of personnel for your organization, or a sales training about identifying your ideal customer from among a …

Filtration is a physical process by which the solid particles are separated from liquids or gases using a filter or a membrane as a medium that retains solid particles and let the liquid or gases to pass through the membrane or filter. What is Filtration?

Some fluid remains on the feed side of the filter or embedded in the filter media and some small solid particulates find their way through the filter. As a chemistry and engineering technique, there is always some lost product, whether it’s the liquid or solid being collected. Examples of Filtration

Filtration Diagram

Avalanche Snow Slab Diagram

Slab Avalanches. The two main avalanches are loose snow and slab avalanches. These two types of avalanches are distinguished by the snow condition at the origin. However, sometimes classifications must be modified on long avalanches, due to the fact that snow conditions vary throughout the avalanche.

However, wind alone will not cause a slab avalanche. Gravity and the strength of the bonds between snow layers are important in slab avalanches. This is because gravity is the force which is pulling the slab down the mountain.

The two main avalanches are loose snow and slab avalanches. These two types of avalanches are distinguished by the snow condition at the origin. However, sometimes classifications must be modified on long avalanches, due to the fact that snow conditions vary throughout the avalanche.

Avalanche Snow Slab Diagram

Animal Cell Diagram

Find animal cell diagram stock images in HD and millions of other royalty-free stock photos, illustrations and vectors in the Shutterstock collection. Thousands of new, high-quality pictures added every day. Animal Cell Diagram Images, Stock Photos & Vectors | Shutterstock

The diagram, like the one above, will include labels of the major parts of an animal cell including the cell membrane, nucleus, ribosomes, mitochondria, vesicles, and cytosol. The cells of animals are the basic structural units for the wide variety of life we see in the animal kingdom.

Animal Cell is a fundamental topic taught in class 9 and higher. To find more information about the animal cell structure, its types, functions cell diagram or other related topics, please explore BYJU’S Biology. What is an animal cell?

Animal Cell Diagram

Water Evaporation Diagram

Evaporation is simply the process by which liquid turns into a gas. Water (a liquid) turns into vapor (a gas) when heat energy is applied to raise its temperature to 100°C (212°F). Water in the liquid state is a compound, and the heat breaks up the bonds into water molecules, which is gaseous. Diagram of water changing to vapor and rising upward.

Evaporation of water from a water surface – like an open tank, a swimming pool or similar – depends on water temperature, air temperature, air humidity and air velocity above the water surface. The amount of evaporated water can be expressed as: g s = Θ A (x s – x) / 3600 (1) or.

Evaporation is the primary pathway that water moves from the liquid state back into the water cycle as atmospheric water vapor. Studies have shown that the oceans , seas, lakes, and rivers provide nearly 90 percent of the moisture in the atmosphere via evaporation, with the remaining 10 percent being contributed by plant transpiration .

Water Evaporation Diagram