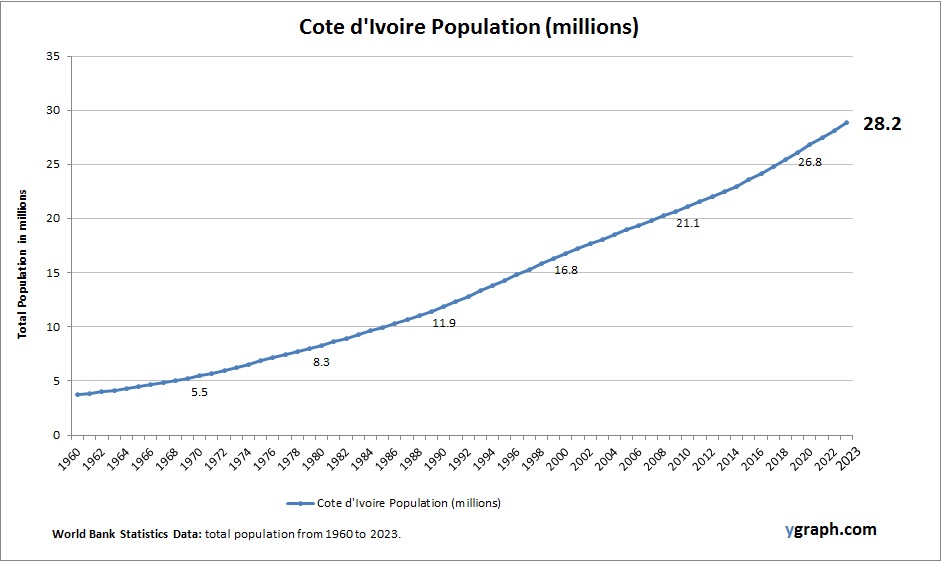
Population Graphs

Population analysis of various cities is a fascinating topic that can provide insights into the growth and development of urban areas. According to a recent report by Statistics Canada, nearly three in four Canadians (73.7%) lived in one of Canada’s large urban centres in 2021, up from 73.2% five years earlier. These large urban centres with a population of 100,000 or more people, referred to as census metropolitan areas (CMAs), accounted for most of Canada’s population growth (+5.2%) from 2016 to 2021.

The World Bank Group has also studied the impact of population growth, aging, and migration on the growth trajectories of cities. The analysis of demographic trends is particularly relevant as larger shares of people move to or live in urban areas.

The United States Census Bureau provides data on city and town populations for years 2020 to 2022. For the most recent data available, please refer to the Vintage 2022 data.

The 2021 Census of Population by Statistics Canada presents information on population for various levels of geography, including provinces and territories, census metropolitan areas, communities, and census tracts.

It is important to note that population growth in cities is increasing the need for infrastructure, transportation, and services of all kinds, including front-line emergency services. Further urban spread also raises environmental concerns such as car-dependent cultures and encroachment on farmlands, wetlands, and wildlife.

Population Graphs

Population Pyramid Chart

A population pyramid is a graphical representation of the age and sex distribution of a population. It is often used by demographers, who study the characteristics and trends of human populations. A population pyramid can help us understand the past, present, and future of a population, as well as its social and economic implications.

A population pyramid consists of two horizontal bar charts, one for each sex, that are stacked vertically. The horizontal axis shows the percentage or number of people in each age group, while the vertical axis shows the age groups, usually in five-year intervals. The shape of the population pyramid reflects the age structure of the population, which is influenced by factors such as fertility, mortality, and migration.

There are different types of population pyramids, depending on the stage of demographic transition of a population. Demographic transition is a theory that describes how populations change over time from high birth and death rates to low birth and death rates, as they undergo social and economic development. The four main stages of demographic transition are:

– Stage 1: Pre-industrial. The population has a high birth rate and a high death rate, resulting in a low or zero growth rate. The population pyramid has a wide base and a narrow top, indicating a large proportion of young people and a low life expectancy.
– Stage 2: Early industrial. The population has a high birth rate and a declining death rate, resulting in a high growth rate. The population pyramid has a triangular shape, indicating a rapid increase in population size and a large youth bulge.
– Stage 3: Late industrial. The population has a declining birth rate and a low death rate, resulting in a moderate growth rate. The population pyramid has a bell shape, indicating a slowing down of population growth and a more balanced age structure.
– Stage 4: Post-industrial. The population has a low birth rate and a low death rate, resulting in a low or negative growth rate. The population pyramid has a rectangular shape, indicating a stable or shrinking population size and an aging population.
ome populations may also experience a fifth stage of demographic transition, where the birth rate falls below the death rate, resulting in a negative growth rate and a population decline. The population pyramid in this stage has an inverted shape, indicating a higher proportion of elderly people than young people.

Population pyramids can also vary by region, country, or other subgroups within a population, depending on their specific demographic characteristics and histories. For example, some countries may have a more youthful or elderly population than others, due to differences in fertility, mortality, migration, or other factors. Some countries may also have a more skewed sex ratio than others, due to preferences for sons, sex-selective abortions, or gender-based violence.

Population pyramids can be useful tools for analyzing and comparing the demographic profiles of different populations, as well as for planning and policymaking. For example, population pyramids can help us understand the potential challenges and opportunities that a population may face in terms of education, health, labor, social security, environment, and development. Population pyramids can also help us predict the future trends and needs of a population, based on the current and projected age and sex composition.

Population Pyramid Chart In Excel

World Population Projections & Age Profile

World population projections are estimates of the future size, growth, and distribution of the human population, based on assumptions about fertility, mortality, and migration. World population projections are useful for understanding the past, present, and future trends of the population, as well as for planning and policymaking in various fields, such as health, education, environment, and development.

One of the main sources of world population projections is the United Nations, which publishes the World Population Prospects every two years. The latest edition, the 2022 revision, presents population estimates from 1950 to 2021, and population projections from 2021 to 2100, for 237 countries and regions, and for the world as a whole. The projections are based on three scenarios: low, medium, and high fertility, which reflect different assumptions about the future levels and trends of fertility in each country and region.

According to the medium-fertility scenario, which is the most widely used and cited, the world population is projected to increase from 7.9 billion in 2021 to 9.7 billion in 2050, and to 10.9 billion in 2100. This means that the world population will grow by 22% between 2021 and 2050, and by 38% between 2021 and 2100. However, the growth rate of the world population will slow down over time, from 1.0% per year in 2021-2025, to 0.5% per year in 2045-2050, and to 0.1% per year in 2095-2100.

The world population growth will also vary by region and by country. Some regions and countries will experience faster or slower growth, or even decline, depending on their fertility, mortality, and migration patterns. The following table shows the projected population size and growth rate of the major regions of the world in 2021, 2050, and 2100, according to the medium-fertility scenario:

| Region | Population (millions) | Growth rate (% per year) |
| | 2021 | 2050 | 2100 | 2021-2050 | 2050-2100 |
| World | 7,874 | 9,735 | 10,875 | 0.8 | 0.3 |
| Africa | 1,373 | 2,489 | 3,775 | 2.5 | 1.3 |
| Asia | 4,678 | 5,267 | 5,096 | 0.4 | -0.1 |
| Europe | 748 | 710 | 603 | -0.2 | -0.5 |
| Latin America and the Caribbean | 653 | 769 | 768 | 0.6 | 0.0 |
| Northern America | 368 | 435 | 500 | 0.6 | 0.4 |
| Oceania | 43 | 66 | 83 | 1.5 | 0.7 |

The table shows that Africa will be the fastest-growing region in the world, with its population more than doubling by 2050, and nearly tripling by 2100. Asia will remain the largest region in the world, but its population will peak around 2050, and then decline slightly by 2100. Europe will be the only region to experience a population decline by 2050, and will continue to shrink by 2100. Latin America and the Caribbean will have a moderate population growth by 2050, but will stabilize by 2100. Northern America and Oceania will have a steady population growth throughout the century.

The table also shows that the world population will become more concentrated in Africa and Asia, which will account for 86% of the world population by 2100, up from 77% in 2021. Europe and Latin America and the Caribbean will see their shares of the world population decline, from 10% and 8% in 2021, to 6% and 7% in 2100, respectively. Northern America and Oceania will maintain their shares of the world population, at 5% and 1%, respectively.

World population projections also provide information about the age structure and composition of the population, which are important indicators of the demographic and social characteristics of a population. The age structure of a population refers to the distribution of the population by age groups, such as children, working-age adults, and elderly. The age composition of a population refers to the proportion of the population in each age group, such as the child dependency ratio, the old-age dependency ratio, and the median age.

The age structure and composition of the world population will change significantly over time, as a result of the changes in fertility, mortality, and migration. The following table shows the projected age composition of the world population in 2021, 2050, and 2100, according to the medium-fertility scenario:

| Age group | Population (millions) | Proportion (%) |
| | 2021 | 2050 | 2100 | 2021 | 2050 | 2100 |
| 0-14 | 1,907 | 2,015 | 2,015 | 24.2 | 20.7 | 18.5 |
| 15-64 | 5,270 | 6,125 | 6,303 | 66.9 | 62.9 | 57.9 |
| 65+ | 697 | 1,595 | 2,557 | 8.9 | 16.4 | 23.5 |
| Child dependency ratio | 36.2 | 32.9 | 32.0 | | | |
| Old-age dependency ratio | 13.2 | 26.0 | 40.6 | | | |
| Median age | 31.0 | 36.6 | 42.6 | | | |

The table shows that the world population will age over time, as the proportion of children will decline, and the proportion of elderly will increase. The child dependency ratio, which measures the number of children under 15 per 100 working-age adults, will decrease from 36.2 in 2021, to 32.9 in 2050, and to 32.0 in 2100. The old-age dependency ratio, which measures the number of elderly over 65 per 100 working-age adults, will increase from 13.2 in 2021, to 26.0 in 2050, and to 40.6 in 2100. The median age, which measures the age at which half of the population is older and half is younger, will increase from 31.0 in 2021, to 36.6 in 2050, and to 42.6 in 2100.

The aging of the world population will have various implications for the social and economic development of the world, such as the demand for health care, pensions, and social services, the supply of labor and human capital, and the potential for innovation and productivity. The aging of the world population will also vary by region and by country, depending on their demographic trajectories and policies. Some regions and countries will face more challenges and opportunities than others, as they cope with the changing age structure and composition of their populations.

In conclusion, world population projections are valuable tools for understanding and anticipating the future of the human population, as well as for informing and guiding the actions and decisions of various stakeholders, such as governments, international organizations, civil society, and individuals. World population projections are based on assumptions and uncertainties, and are subject to revisions and updates, as new data and information become available. World population projections are not predictions or forecasts, but scenarios and possibilities, that reflect the potential outcomes of the demographic trends and transitions of the world population.

World Population Projections & Age Profile

United States population projection

US future population projections until 2100. United States population is expected to continue growing driven by immigration, longevity and relatively healthy birth rate. The USA population chart offers various projections based on conservative, low, medium and high growth scenarios but all are showing population growth.

United States population projection

India future population

India future population projections until 2100. Indian population is set to decline around 2060 due to the aging of its people. These are still very distant projections and thus may be inaccurate. However, this population chart offers various projections based on conservative, low, medium and high growth scenarios.

India future population

World population projection 2100

World future population projections until 2100. World population is set to plateau around 2100. These are still very distant projections and thus may be inaccurate. However, this population chart offers various projections based on conservative, low, medium and high growth scenarios.

World population projection 2100