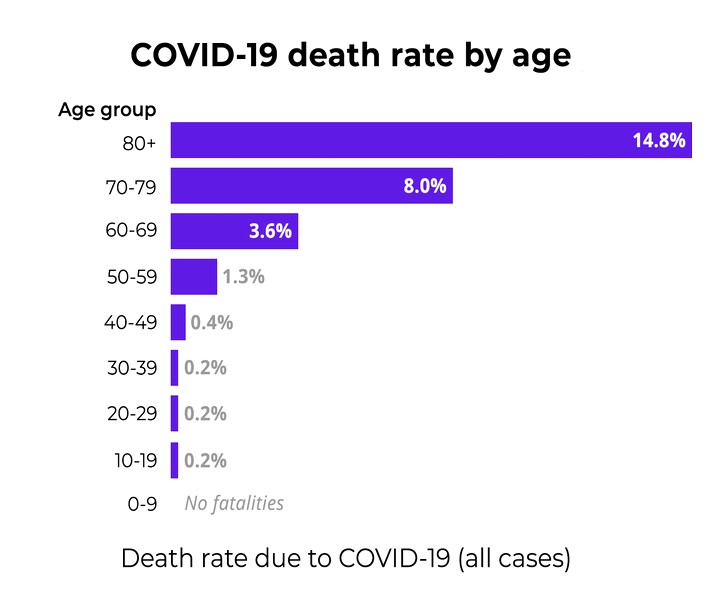
Covid Deaths by Age Group Chart – The below diagram shows Covid 19 deaths by various ages and shows that fatality rates are a lot higher for older population. Corona virus death stats all cases by age group Covid deaths by age group
Covid Deaths by Age Group Chart – The be

