How to Stop Time from Flying

Featured

7 Practical Ways to Slow Down Your Days

Do you ever feel like weeks slip by in a blur? You blink, and it’s already the weekend—or even the end of the year. That fast-forward feeling is surprisingly common, but the good news is there are simple strategies to slow it down. If you’re wondering how to stop time from flying, you’re in the right place. Here are 7 proven tips to help make your days feel longer, more meaningful, and fully lived.

1. Add Novelty to Your Routine

Our brains encode new experiences more vividly than repetitive ones. If every day feels the same, time compresses in memory. Try something new—a hobby, a new recipe, or even a different walking route. Variety stretches your perception of time and creates a richer mental timeline.

2. Practice Mindfulness and Presence

Being fully present in the moment slows time down. Whether you’re drinking coffee or folding laundry, focus completely on the experience. Mindfulness meditation and breathing techniques can also anchor you in the now and help prevent time from slipping away unnoticed.

3. Keep a Daily Journal

Writing down what you did each day helps solidify the memory of it. Even a short journal entry acts as a time marker, giving your brain more to recall later. It’s a powerful way to make time feel fuller and less like it’s vanishing.

4. Break Up Your Week with Micro-Adventures

Don’t wait for vacations to shake things up. Plan small adventures throughout your week. Go to a new café, try a local museum, or explore a new neighborhood. The more novel experiences you insert into your regular schedule, the less your life blurs together.

5. Engage in Deep Work or Flow Activities

Time flies in the moment when you’re focused—but paradoxically, those same moments feel long and rewarding in memory. Get lost in activities you love or find meaningful: writing, painting, coding, gardening. That deep focus stretches time in the long run.

6. Take Photos and Reflect

Take intentional photos of people, places, and things—not everything, just the highlights. Reviewing your photos at the end of the week or month helps reinforce those moments, building a sense of time well spent and remembered.

7. Spend Time Offline with People

Conversations, shared meals, and real-life experiences stick with us more than scrolling social media. Being present with others doesn’t just build stronger relationships—it also helps you mark time in more meaningful ways. Trust me on this 🙂

Make Time Count

If you’re constantly wondering how to stop time from flying, remember it’s not about slowing the clock—it’s about filling your life with presence, meaning, and memorable moments. By making small, intentional changes to how you live each day, you can create a sense of time that feels expansive instead of elusive.

Try just one of these tips this week and notice how your days begin to feel different.

how to stop time.jpg

British Virgin Islands Population

This diagram presents British Virgin Islands Population. World Bank is the source of this population data. Based on the latest available information for British Virgin Islands.

The British Virgin Islands have a small population that fluctuates with migration trends and tourism-driven economic activity. Fertility rates are moderate, and the demographic structure is shaped by both native islanders and expatriates seeking economic opportunities.

British Virgin Islands Population

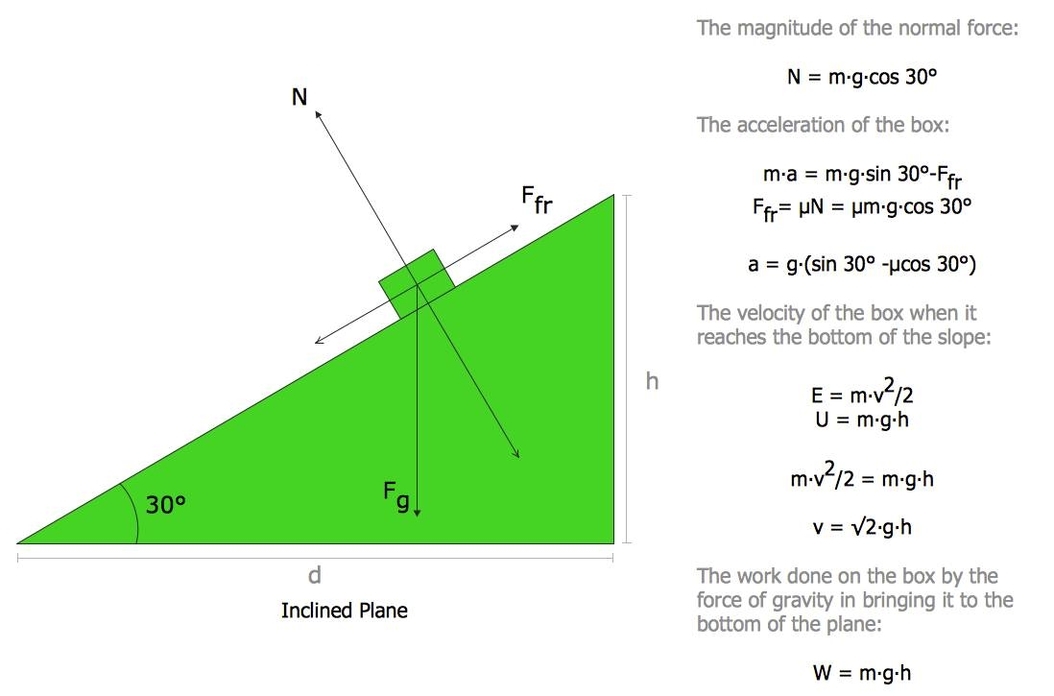
Chemistry Experiment Illustration

Chemistry Experiment: A chemistry experiment is a scientific procedure conducted to investigate chemical reactions, properties, or phenomena. Experiments involve forming hypotheses, conducting controlled tests, observing results, and drawing conclusions. They are fundamental to advancing knowledge in chemistry.

Chemistry Experiment Illustration

European Union Population

This diagram presents European Union Population. World Bank is the source of this population data. Based on the latest demographics info provided for European Union.

The European Union has a large population characterized by low fertility rates and an aging demographic. Population growth is largely driven by immigration. Urbanization is widespread, and member states face challenges related to workforce sustainability, social welfare, and integration of migrants. Policies aim to balance demographic trends with economic growth and social cohesion.

European Union Population

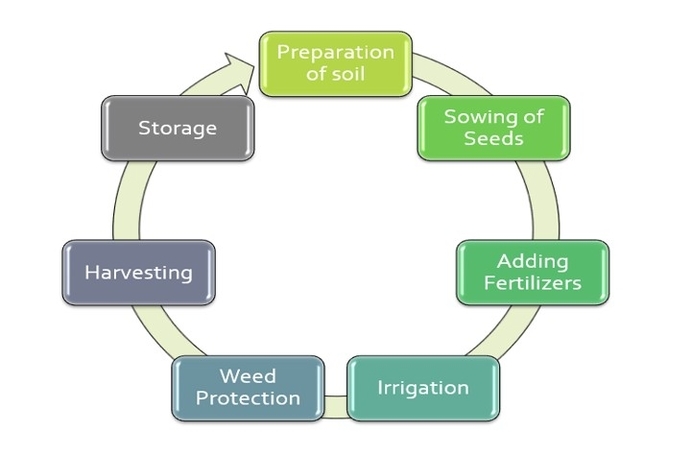
Assessment Flow Chart

Assessment Flow: Assessment flow refers to the systematic process of evaluating a subject or situation. It involves steps such as data collection, analysis, interpretation, and reporting. This flow ensures that assessments are organized, comprehensive, and yield actionable insights.

Assessment Flow Chart

West Bank and Gaza Population

The above graph shows West Bank and Gaza Population. The country statistics are compiled by World Bank. Based on the latest demographics info provided for West Bank and Gaza.

The West Bank and Gaza have a young and rapidly growing population with high fertility rates. Political and economic challenges influence demographic trends, while urbanization and migration affect population distribution and growth patterns.

West Bank and Gaza Population

United States Births per woman

This diagram presents United States Births per woman. This is according to World Bank birth stats by country. Based on the latest demographics info provided for United States.

The United States has a fertility rate near or slightly below replacement level, influenced by diverse social and economic factors. Immigration helps maintain population growth, while urbanization, education, and economic conditions shape family size decisions. Healthcare access and cultural diversity create varied demographic experiences.

United States Births per woman

Liberia Population

This diagram presents Liberia Population. The country statistics are compiled by World Bank. Latest population information for Liberia.

Liberia’s population is youthful and growing, with high birth rates driving demographic expansion. Recovery from years of conflict and investment in health and education have led to gradual improvements, although challenges persist in rural healthcare access. Urbanization is increasing, particularly in Monrovia, as people seek better services and opportunities.

Liberia Population

Us Gdp Growth Chart

The Gross Domestic Product (GDP) of the United States is a measure of the country’s economic output. It is the total value of all goods and services produced in the country over a given period of time. The GDP growth rate is the percentage increase or decrease in GDP from one period to another.

According to the U.S. Bureau of Economic Analysis, the real GDP of the United States increased at an annual rate of 4.9% in the third quarter of 2023, which is the most since the last quarter of 2021 . This growth rate is slightly below the second estimate of 5.2%, but matches the 4.9% initially reported in the advance estimate . The increase in the third quarter primarily reflected increases in consumer spending and inventory investment .

On the expenditure side, personal consumption expenditures account for 68% of total GDP, out of which purchases of goods constitute 23% and services 45%. Private investment accounts for 16% of GDP and government consumption and investment for 18%. As the value of goods exported (13.5%) is lower than the value of goods imported (16.5%), net exports subtracts 3% from the total GDP value .

The GDP growth rate of the United States has been volatile over the years. In 2022, the real GDP of the United States increased by 2.1% compared to 2021 . This rate of annual growth indicates a return to economy normalcy after 2020 saw a dramatic decline in the GDP growth rate due to the coronavirus (COVID-19) pandemic, and high growth in 2021 .

In conclusion, the GDP growth rate of the United States has been volatile over the years, but the country has seen a strong growth rate of 4.9% in the third quarter of 2023, which is the most since the last quarter of 2021. The increase in the third quarter primarily reflected increases in consumer spending and inventory investment. Personal consumption expenditures account for 68% of total GDP, out of which purchases of goods constitute 23% and services 45%. Private investment accounts for 16% of GDP and government consumption and investment for 18%. As the value of goods exported (13.5%) is lower than the value of goods imported (16.5%), net exports subtracts 3% from the total GDP value..

Us Gdp Growth Chart

Mauritius Births per woman

Chart above demonstrates Mauritius Births per woman. The fertility rate statistics are compiled by World Bank. Based on the latest demographics info provided for Mauritius.

Mauritius has undergone a successful demographic transition with low and stable fertility rates. Improvements in education, healthcare, and economic development have supported smaller family sizes, while aging and workforce dynamics are growing areas of focus.

Mauritius Births per woman

Global Economy 2021

The global economy in 2021 was marked by a recovery from the unprecedented contraction caused by the COVID-19 pandemic in 2020. However, the recovery was uneven and uncertain, as different regions and countries faced different challenges and opportunities. Here is a summary of the main developments and trends in the global economy in 2021, based on the sources from the `search_web` tool:

– The global economy was projected to grow 5.9 percent in 2021 and 4.9 percent in 2022, according to the IMF’s World Economic Outlook. This was a slight downward revision from the previous forecast, reflecting the impact of supply disruptions and worsening pandemic dynamics in some regions. The IMF also warned of the risks of rising inflation, financial sector stress, and climate change.
– The recovery was highly divergent across countries and regions, depending on the pace and effectiveness of vaccine deployment, the extent and quality of policy support, and the structural characteristics of each economy. Advanced economies, especially the United States and China, were expected to recover faster than emerging market and developing economies, especially low-income countries. This widened the gaps in income and living standards between countries and increased the risk of divergence in medium-term growth prospects.
– The World Bank’s Global Economic Prospects report highlighted the importance of policy actions to ensure a sustainable and inclusive recovery. The report called for accelerating vaccine distribution, especially to low-income countries, strengthening fiscal and monetary policy frameworks, addressing debt vulnerabilities, and implementing structural reforms to boost productivity and resilience. The report also emphasized the need for international cooperation on trade, climate change, and digital transformation.
– The global economy faced several challenges and uncertainties in 2021, such as the emergence and spread of new variants of the coronavirus, the persistence of supply chain bottlenecks and labor shortages, the surge in energy and commodity prices, the tightening of monetary policy in some major economies, the escalation of geopolitical tensions, and the intensification of natural disasters and extreme weather events. These factors posed downside risks to the outlook and increased volatility in financial markets.
– The global economy also witnessed some positive developments and opportunities in 2021, such as the rapid development and deployment of vaccines and therapeutics, the unprecedented fiscal and monetary stimulus in many countries, the rebound in trade and investment, the acceleration of digitalization and innovation, the adoption of green and social policies, and the improvement in global cooperation and coordination on various issues.

To conclude, the

Global Economy 2021