World Map Landforms

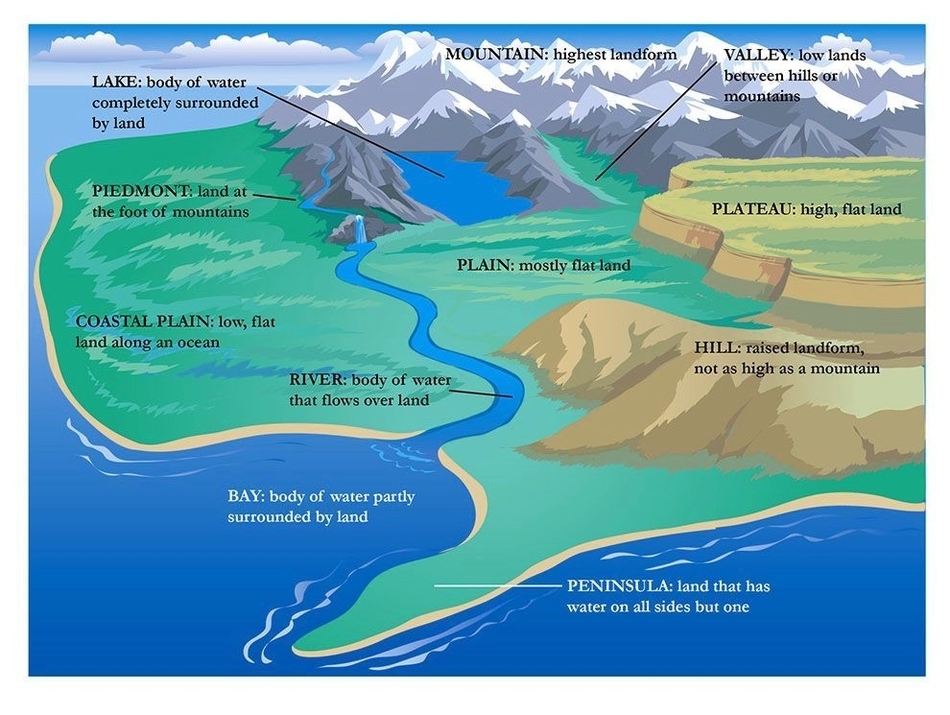
Landforms are natural features of the Earth’s surface that have been formed by various geological processes. They are an essential part of the Earth’s geography and play a crucial role in shaping the planet’s ecosystems. Landforms can be classified into several categories based on their characteristics, such as their elevation, slope, and shape. Some of the most common landforms include mountains, hills, valleys, plateaus, plains, deserts, and canyons.

Mountains are landforms that rise above the surrounding terrain and have steep slopes and high elevations. They are formed by tectonic forces that cause the Earth’s crust to fold and uplift. The highest mountain in the world is Mount Everest, which stands at an elevation of 29,031.7 feet above sea level. Hills are similar to mountains but are smaller in size and have gentler slopes. They are formed by the same geological processes as mountains.

Valleys are low-lying areas between mountains or hills. They are formed by the erosion of the surrounding terrain by water or ice. Valleys can be narrow or wide and can be home to rivers, lakes, or other bodies of water. Plateaus are flat, elevated landforms that are higher than the surrounding terrain. They are formed by the uplift of the Earth’s crust and can be found on every continent. The Tibetan Plateau is the highest plateau in the world, with an average elevation of over 14,800 feet.

Plains are flat, low-lying areas that are generally covered by grasses or other vegetation. They are formed by the deposition of sediment by rivers, wind, or glaciers. Plains can be found on every continent and are often used for agriculture. Deserts are dry, barren areas that receive very little rainfall. They are formed by the interaction of atmospheric and geological processes and can be found on every continent. The Sahara Desert in Africa is the largest hot desert in the world, covering over 3.6 million square miles.

Canyons are deep, narrow valleys with steep sides. They are formed by the erosion of rock by water or wind. Canyons can be found in many parts of the world and are often home to rivers or other bodies of water. The Grand Canyon in the United States is one of the most famous canyons in the world, with a depth of over a mile and a length of over 277 miles.
World Map Landforms

Balanced Vs Unbalanced Forces

Balanced vs Unbalanced Forces

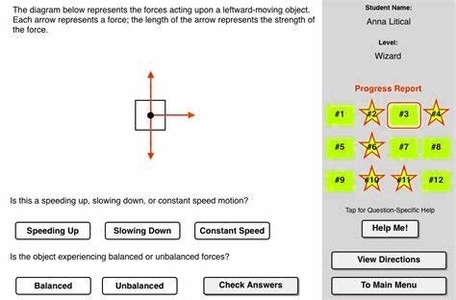
Balanced and unbalanced forces are two concepts in physics that describe the relationship between forces acting on an object and the object’s motion. A force is a push or a pull that can change the speed, direction, or shape of an object. Forces can be classified as balanced or unbalanced depending on whether they cause a change in the object’s motion or not.

Balanced forces are forces that are equal in magnitude and opposite in direction. When two or more forces act on an object and cancel each other out, they are said to be balanced. Balanced forces do not cause a change in the object’s motion; the object will either remain at rest or continue moving at a constant velocity. For example, when a book is resting on a table, the force of gravity pulling the book down is balanced by the normal force of the table pushing the book up. The net force on the book is zero, so the book does not move.

Unbalanced forces are forces that are not equal in magnitude and/or direction. When two or more forces act on an object and do not cancel each other out, they are said to be unbalanced. Unbalanced forces cause a change in the object’s motion; the object will either accelerate or decelerate. For example, when a person kicks a soccer ball, the force of the foot on the ball is greater than the force of gravity and air resistance on the ball. The net force on the ball is not zero, so the ball changes its speed and direction.

The net force on an object is the vector sum of all the forces acting on it. A vector is a quantity that has both magnitude and direction. To find the net force, we can use the following rules:

– If two forces act in the same direction, we add their magnitudes to find the net force. The direction of the net force is the same as the direction of the individual forces.
– If two forces act in opposite directions, we subtract their magnitudes to find the net force. The direction of the net force is the same as the direction of the larger force.
– If two forces act at an angle, we can use trigonometry or a graphical method to find the net force. The direction of the net force is the direction of the resultant vector.

The net force determines whether the forces are balanced or unbalanced. If the net force is zero, the forces are balanced and the object does not change its motion. If the net force is not zero, the forces are unbalanced and the object changes its motion. The net force also determines the acceleration of the object according to Newton’s second law of motion, which states that the net force on an object is equal to its mass times its acceleration. Mathematically, this can be written as $$vec{F}_{net} =

Balanced Vs Unbalanced Forces

Work Physics Definition

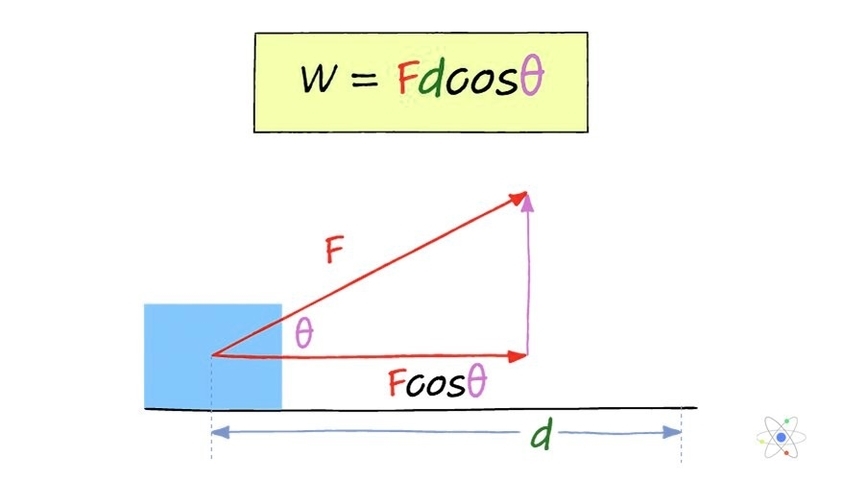
In physics, work is defined as the energy transferred to or from an object via the application of force along a displacement . In simpler terms, work is done when a force is applied to an object and the object moves in the direction of the force. The amount of work done is equal to the force applied multiplied by the distance the object moves in the direction of the force .

The SI unit of work is the joule (J), which is defined as the amount of work done when a force of one newton is applied over a distance of one meter in the direction of the force . Other units of work include the foot-pound and the erg .

Work can be either positive or negative depending on the direction of the force and the displacement of the object. If the force and displacement are in the same direction, the work done is positive. If the force and displacement are in opposite directions, the work done is negative .

For example, when a ball is held above the ground and then dropped, the work done by the gravitational force on the ball as it falls is positive, and is equal to the weight of the ball (a force) multiplied by the distance to the ground (a displacement). If the ball is thrown upwards, the work done by the gravitational force is negative, and is equal to the weight multiplied by the displacement in the upwards direction .

Work Physics Definition

U.s. Economy Charts And Graphs

The United States of America has the world’s largest economy by nominal GDP and the second-largest by purchasing power parity (PPP) behind China . The country has a highly developed/advanced mixed economy with a diversified North American economy . The economy is driven by the service sector, which accounts for 80.2% of the GDP, followed by industry and agriculture . The United States is home to some of the world’s largest corporations, including Apple, Amazon, and Microsoft .

The US economy has been growing at a steady pace in recent years. In 2022, the GDP growth rate was 2.1%, and it is expected to remain at 2.1% in 2023 and 1.5% in 2024 . The unemployment rate has been below 4% for 23 consecutive months, the longest such run since the 1960s . The average gross salary in the US is $5,407 per month . The US economy is also the world’s largest importer and exporter of goods and services .

The US economy is regulated by the government, which imposes regulations to protect the good of all . The country operates as a free market economy in consumer goods and business services, while it operates as a command economy in defense, some retirement benefits, medical care, and in other areas . The US dollar is the world’s primary reserve currency, and the country is home to the world’s largest stock exchange, the New York Stock Exchange .

The US economy has faced several challenges in recent years, including the COVID-19 pandemic, which led to a significant economic downturn in 2020 . The country has also been grappling with issues such as income inequality, trade deficits, and climate change . However, the US economy has shown resilience in the face of these challenges and continues to be a major player in the global economy.

In conclusion, the US economy is the world’s largest economy by nominal GDP and the second-largest by purchasing power parity (PPP) behind China. The country has a highly developed/advanced

U.s. Economy Charts And Graphs

Tree Diagramprobability Tree

Tree probability tree is a visual tool used to calculate probabilities in a simple way. It is a type of probability diagram that is used to organize your thinking and make calculating probabilities much easier. A probability tree diagram consists of two parts – nodes and branches. A node is used to represent an event. A branch is used to denote the connection between an event and its outcome.

To understand how a probability tree diagram works, let’s consider an example. Suppose you are flipping a coin that has heads on one side and tails on the other. The probability of getting either heads or tails is fifty-fifty, which is 0.5 or 1/2. This simple probability tree diagram has two branches: one for each possible outcome heads or tails. Notice that the outcome is located at the end-point of a branch (this is where a tree diagram ends). Also, notice that the probability of each outcome occurring is written as a decimal or a fraction on each branch.

Now, let’s look at a probability tree diagram for flipping a coin twice. Notice that this tree diagram is portraying two consecutive events (the first flip and the second flip), so there is a second set of branches. Using the tree diagram, you can see that there are four possible outcomes when flipping a coin twice: Heads/Heads, Heads/Tails, Tails/Heads, Tails/Tails. And since there are four possible outcomes, there is a 0.25 (or ¼) probability of each outcome occurring. So, for example, there is a 0.25 probability of getting heads twice in a row.

The rule for finding the probability of a particular event in a probability tree diagram occurring is to multiply the probabilities of the corresponding branches. For example, to prove that there is 0.25 probability of getting two heads in a row, you would multiply 0.5 x 0.5 (since the probability of getting a heads on the first flip is 0.5 and the probability of getting heads on the second flip is also 0.5). 0.5 x 0.5 = 0.25. Repeat

Tree Diagramprobability Tree

World Economy Gdp

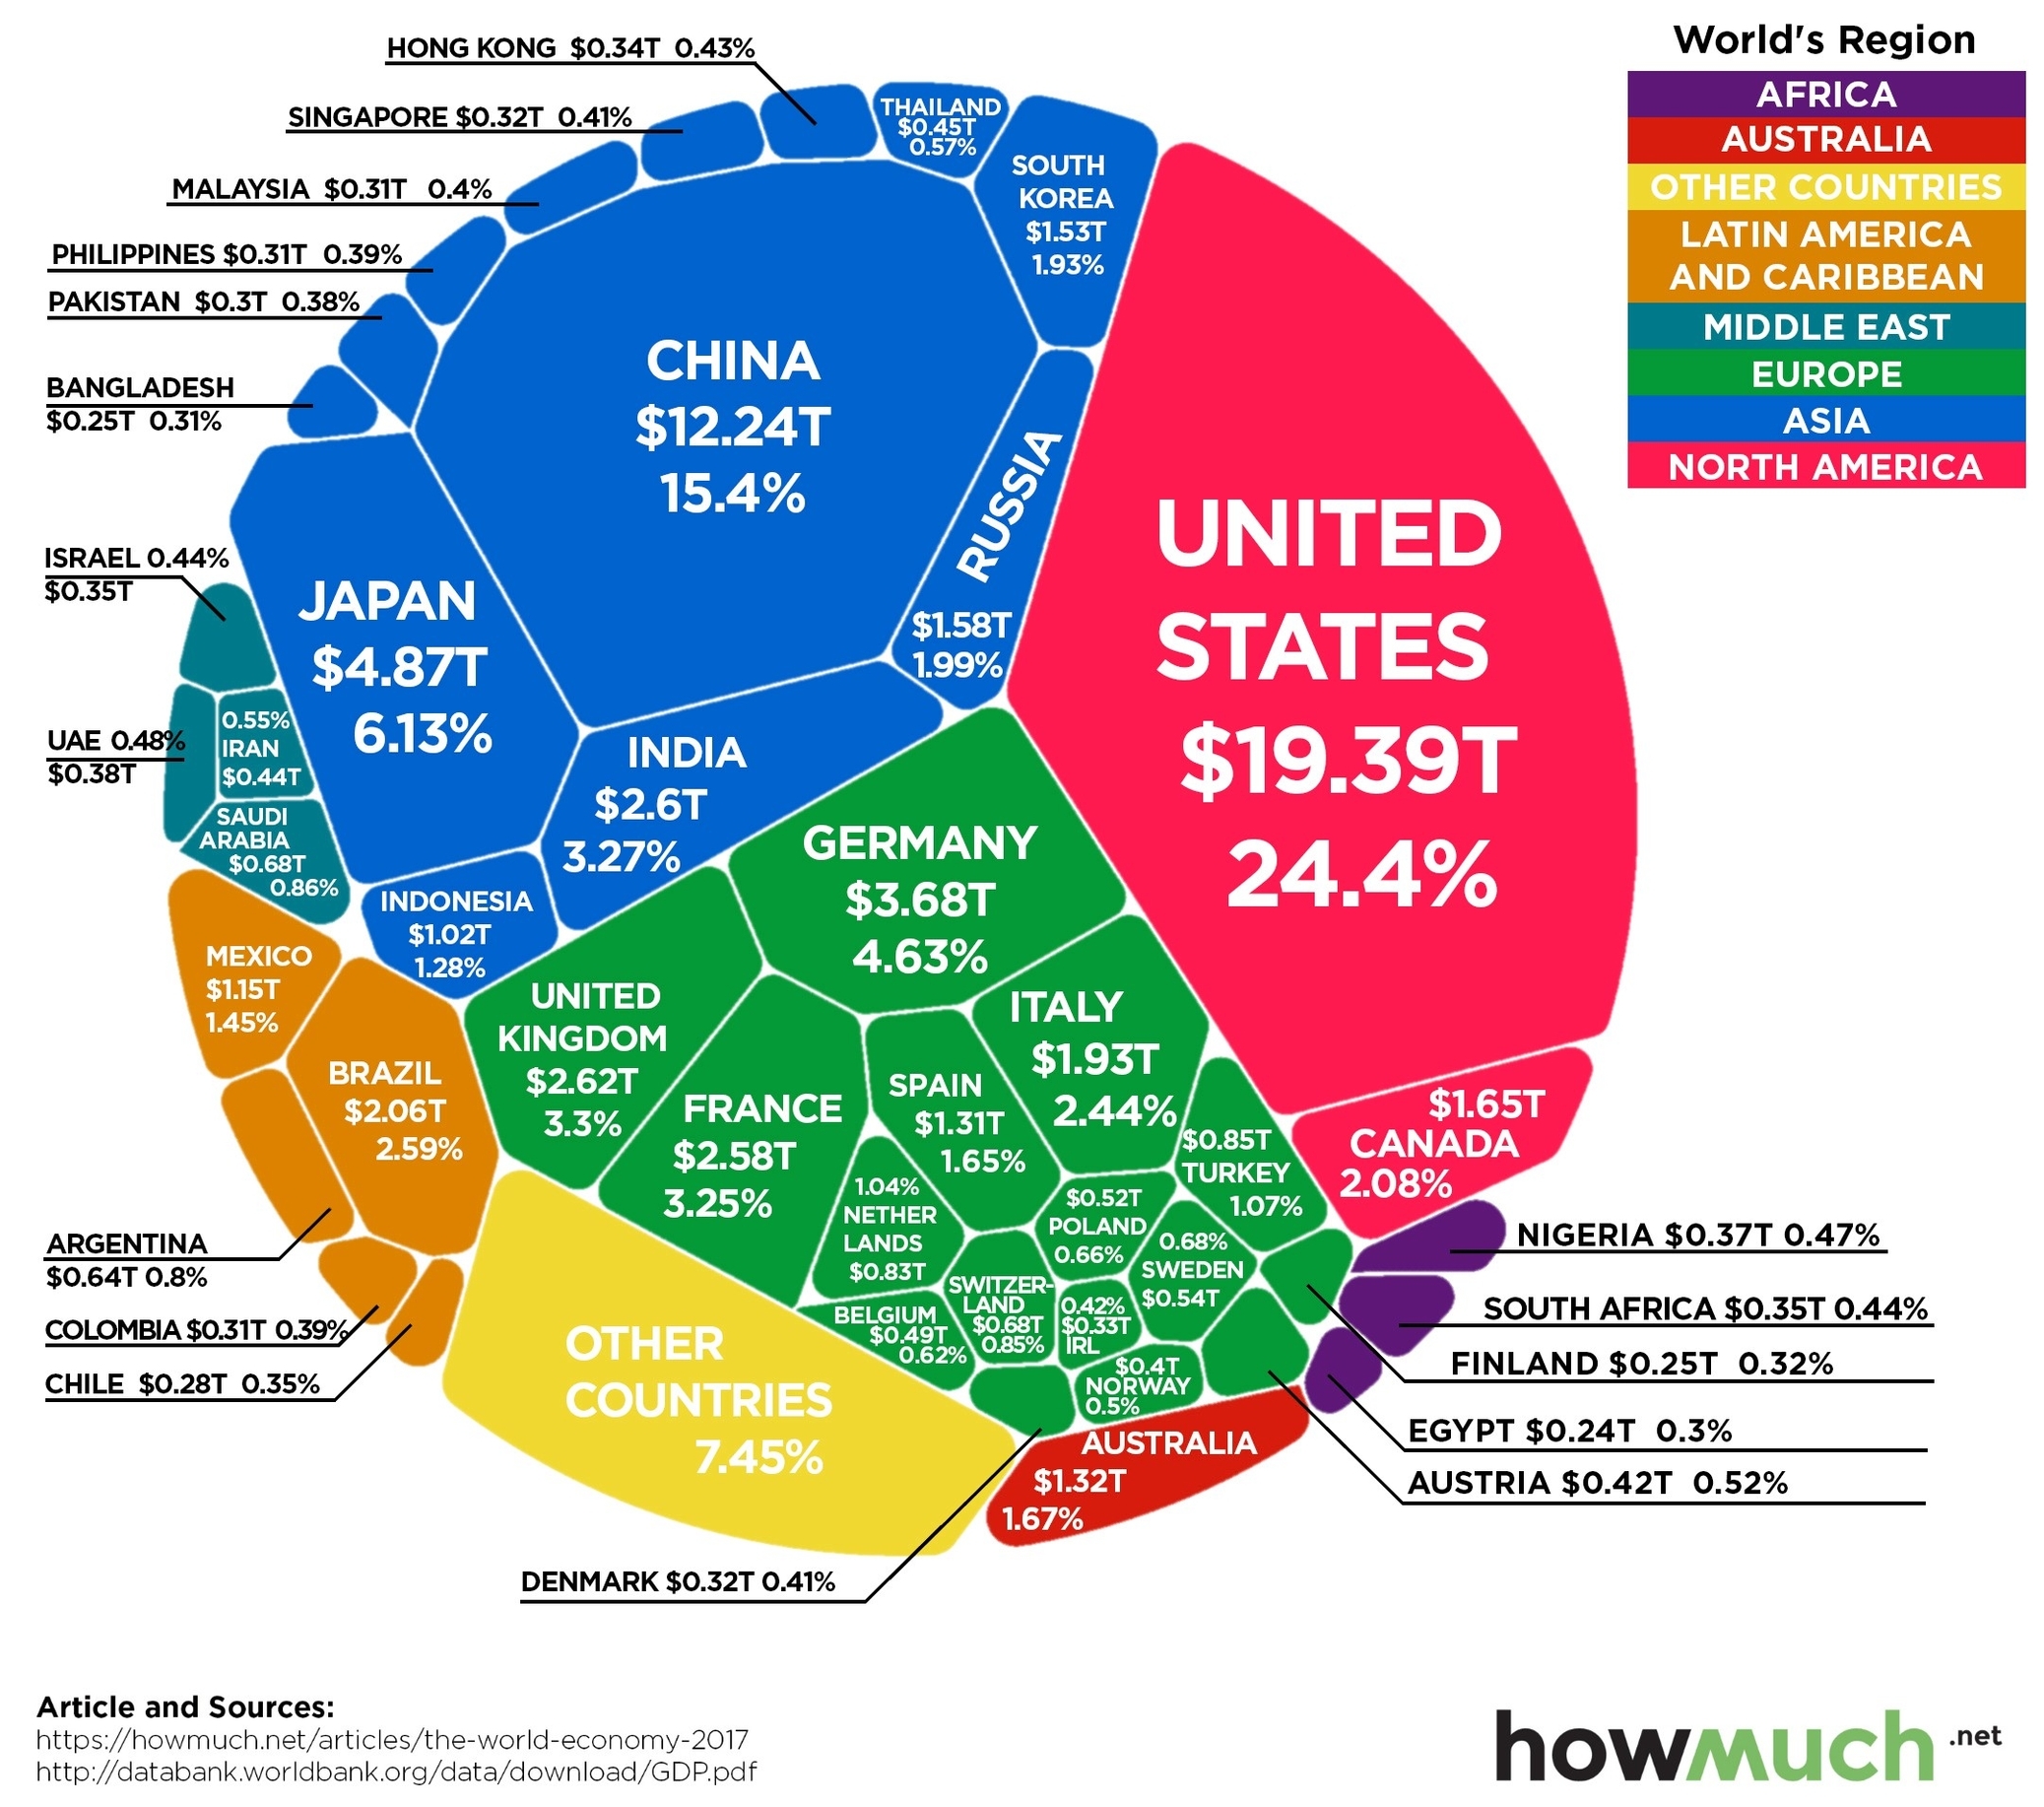
The Gross Domestic Product (GDP) is a measure of the economic performance of a country. It is the total value of all goods and services produced within a country in a given year. The GDP is an important indicator of the economic health of a country and is used to compare the economic performance of different countries. According to the International Monetary Fund (IMF), the world’s nominal GDP in 2022 was $100,562,000,000,000 .

The nominal GDP of a country is calculated using the market or government official exchange rates. However, nominal GDP does not take into account differences in the cost of living in different countries, and the results can vary greatly from one year to another based on fluctuations in the exchange rates of the country’s currency . Therefore, comparisons of national wealth are also frequently made on the basis of purchasing power parity (PPP), which adjusts for differences in the cost of living in different countries .

The United States has the highest nominal GDP in the world, with a nominal GDP of $25,462,700,000,000 in 2022 . China is the second-largest economy in the world, with a nominal GDP of $17,963,200,000,000 in 2022 . Japan is the third-largest economy in the world, with a nominal GDP of $4,231,140,000,000 in 2022 .

The nominal GDP per capita is another important measure of the economic performance of a country. It is calculated by dividing the nominal GDP of a country by its population. The nominal GDP per capita of the United States is $75,269 in 2022, while that of China is $12,598 in 2022 .

The GDP of a country is influenced by various factors such as the size of the population, natural resources, infrastructure, political stability, and economic policies. The GDP growth rate is an important indicator of the economic health of a country. The global economy is showing signs of improvement, but the recovery will be weak, according to the Organisation for Economic Co-operation and Development (OECD). Its latest Economic Outlook predicts global GDP will grow 2.7% in 2023, with a modest improvement of 2.9% in 2024 .

In conclusion, the GDP is an important measure of the economic performance of a country. The nominal GDP of a country is calculated using the market or government official exchange rates, while the nominal GDP per capita is calculated by dividing the nominal GDP of a country by its population. The GDP of a country is influenced by various factors such as the size of the population, natural resources, infrastructure, political stability, and economic policies. The global economy is showing signs of improvement, but the recovery will be weak, according to the OECD .

World Economy Gdp

Physics Diagram Only

Physics is a branch of science that deals with the study of matter, energy, and their interactions. It is a fundamental science that seeks to explain the natural phenomena that occur in the universe. The study of physics has led to many technological advancements that have transformed the world we live in today.

The field of physics is vast and encompasses many subfields. Some of the major subfields of physics include mechanics, thermodynamics, electromagnetism, optics, and quantum mechanics. Mechanics is the study of motion and the forces that cause motion. Thermodynamics is the study of heat and temperature and their relationship to energy. Electromagnetism is the study of electric and magnetic fields and their interactions. Optics is the study of light and its properties. Quantum mechanics is the study of the behavior of matter and energy at the atomic and subatomic level.

The study of physics is important because it helps us understand the world around us. It provides us with a framework for understanding the laws of nature and how they govern the behavior of matter and energy. Physics has led to many technological advancements that have transformed the world we live in today. For example, the development of the transistor, which is a key component of modern electronics, was made possible by the discovery of quantum mechanics. The study of physics has also led to the development of technologies such as lasers, nuclear power, and medical imaging.

In summary, physics is a fundamental science that seeks to explain the natural phenomena that occur in the universe. It is a vast field that encompasses many subfields, including mechanics, thermodynamics, electromagnetism, optics, and quantum mechanics. The study of physics is important because it helps us understand the world around us and has led to many technological advancements that have transformed the world we live in today.

Physics Diagram Only

Quantum Physics Drawing

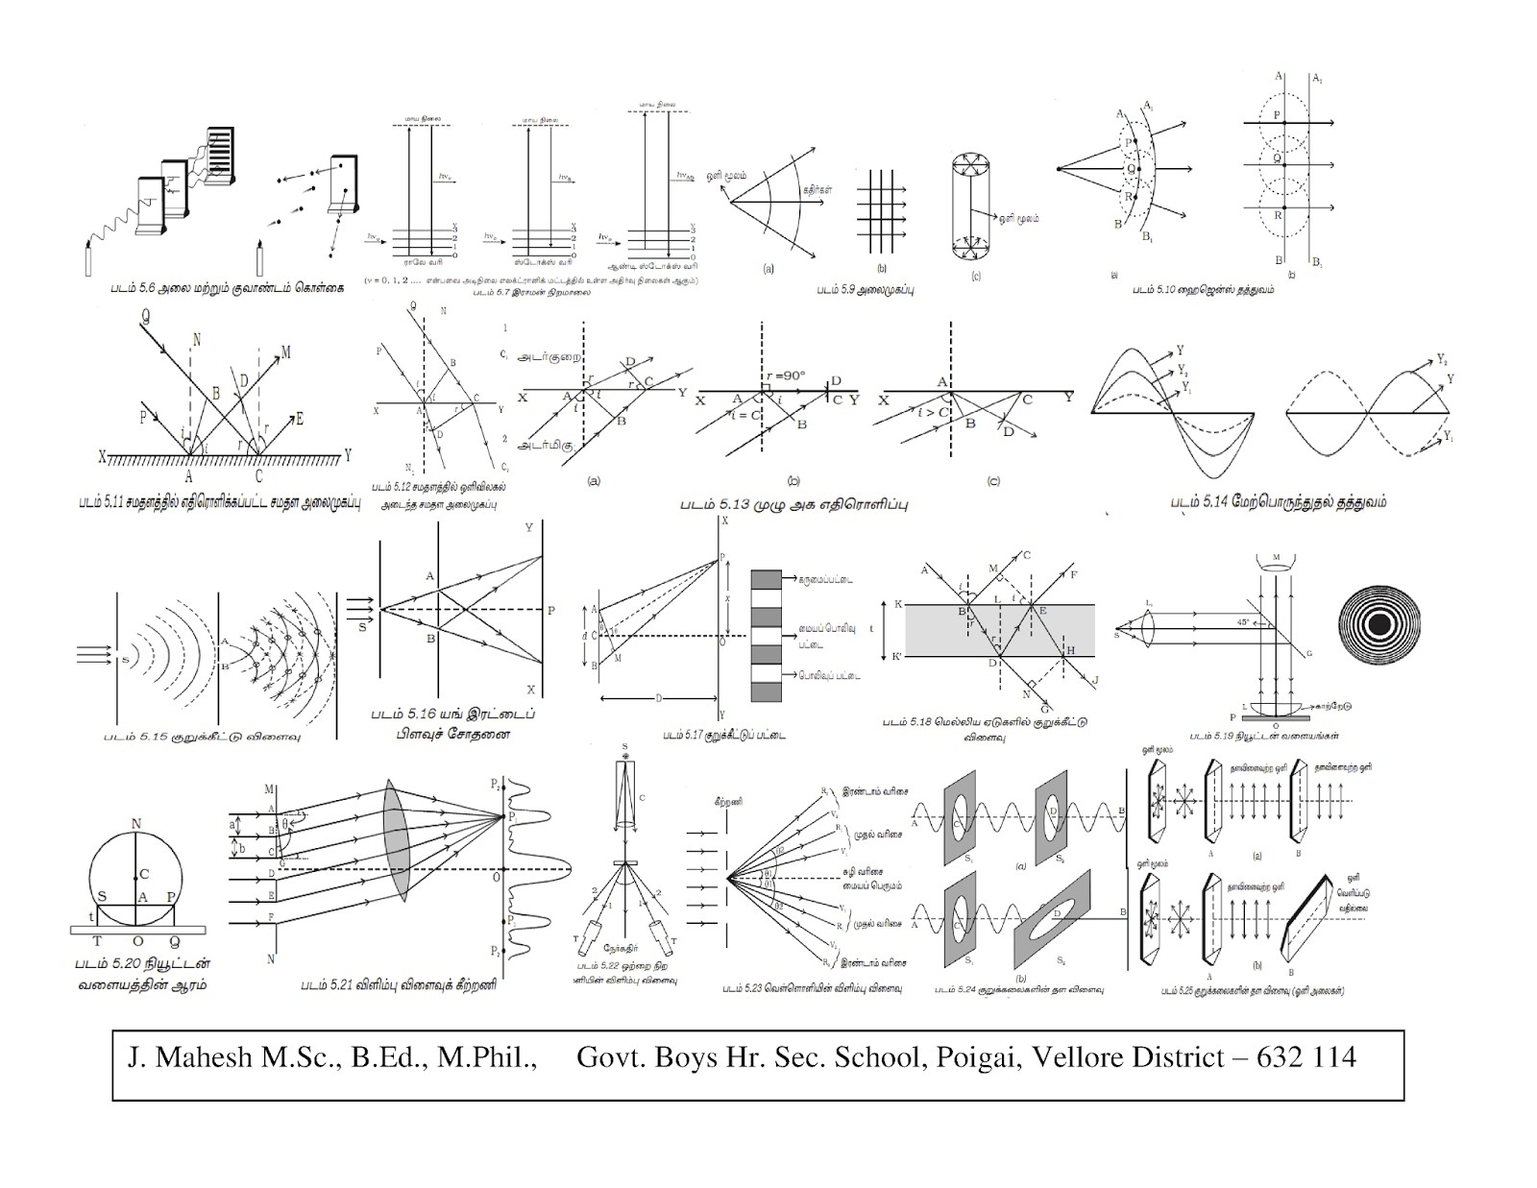
Quantum Physics 98 is not a well-defined term, but it could be interpreted as a course or a topic related to quantum physics, the branch of physics that deals with the behavior of matter and energy at the smallest scales. Quantum physics is based on the idea that physical quantities, such as the position, momentum, energy, and spin of a particle, can only take discrete values, called quanta. Quantum physics also introduces the concept of wave-particle duality, which states that all particles can behave like waves and vice versa, depending on how they are observed. Furthermore, quantum physics reveals the phenomenon of quantum entanglement, which means that two or more particles can share a quantum state and influence each other, even when they are separated by large distances.

Quantum physics is one of the most fascinating and challenging fields of science, as it often defies our common sense and intuition. It also has many applications and implications for technology, information, security, mathematics, and philosophy. Some of the topics that quantum physics covers are:

– The experimental basis of quantum physics, such as the photoelectric effect, the Compton effect, the double-slit experiment, the Stern-Gerlach experiment, and the EPR paradox.
– The mathematical formalism of quantum mechanics, such as the Schrödinger equation, the Heisenberg uncertainty principle, the Dirac notation, the Hilbert space, the operators, the eigenvalues, and the eigenvectors.
– The single and multiple quantum states, such as the qubit, the superposition, the measurement, the collapse, the basis, the entanglement, and the Bell inequalities.
– The quantum operations, such as the unitary transformations, the quantum gates, the quantum circuits, and the quantum algorithms.
– The quantum systems, such as the harmonic oscillator, the hydrogen atom, the spin, the angular momentum, the tunneling, the scattering, and the resonance.
– The quantum technologies, such as the quantum cryptography, the quantum communication, the quantum metrology, the quantum sensing, the quantum simulation, and the quantum computing.

This is a brief overview of quantum physics, but there is much more to learn and explore. If you are interested in taking a course on quantum physics, you can check out some of the online resources available, such as:

– [Quantum Physics I](^2^), a course from MIT OpenCourseWare that introduces the basic features of quantum mechanics and covers the experimental basis of quantum physics, the wave mechanics, and the Schrödinger equation in one and three dimensions.
– [Quantum Physics](^3^), a course from Khan Academy that covers the basics of quantum physics, such as the photoelectric effect, the Bohr model, the de Broglie wavelength, the Heisenberg uncertainty principle, and the quantum numbers.
– [The Mathematics of Quantum Mechanics](^1^), a book from the University of Waterloo that explains the mathematical concepts and tools needed to understand quantum mechanics, such as the complex numbers, the linear algebra, the inner product, the observables, and the postulates.

Quantum Physics Drawing

Bar Diagrams For Problem Solving

The Bar Model is a mathematical diagram that is used to represent and solve problems involving quantities and their relationships to one another. It was developed in Singapore in the 1980s when data showed Singapore’s elementary school students were lagging behind their peers in math. An analysis of testing data at the time showed less than half of Singapore’s students in grades 2-4 could solve word problems that were presented without keywords such as “altogether” or “left.” Something had to be done, and that something was the introduction of the bar model, which has been widely credited with rocketing the kids of Singapore to the top of math scores for kids all around the globe .

The Bar Model is an explicit teaching and learning strategy for problem-solving. The actual bar model consists of a set of bars or rectangles that represent the quantities in the problem, and the operations are represented by the lengths and arrangements of the bars. Among its strengths is the fact that it can be applied to all operations, including multiplication and division. They’re also useful when it comes to teaching students more advanced math concepts, such as ratios and proportionality. The Bar Model combines the concrete (drawings) and the abstract (algorithms or equations) to help the student solve the problem .

The Bar Model is a powerful tool for visualizing and solving mathematical problems. It is especially useful for students who struggle with abstract concepts and need a more concrete way to understand mathematical relationships. The Bar Model can be used to solve a wide range of problems, from simple addition and subtraction to more complex algebraic equations. The Bar Model is also a great way to introduce students to the concept of algebra, as it provides a visual representation of the relationships between variables .

The Bar Model is a versatile tool that can be used in a variety of ways to help students learn math. For example, it can be used to help students understand fractions and decimals, as well as to solve problems involving percentages. The Bar Model can also be used to help students understand geometry, as it provides a visual representation of geometric shapes and their properties. In addition, the Bar Model can be used to help students understand data analysis and statistics, as it provides a way to visualize data and relationships between variables .

In conclusion, the Bar Model is a powerful tool for teaching and learning mathematics. It provides a concrete way for students to visualize and solve mathematical problems, and it can be used to teach a wide range of mathematical concepts. The Bar Model is especially useful for students who struggle with abstract concepts and need a more concrete way to understand mathematical relationships. By using the Bar Model, teachers can help their students develop a deeper understanding of mathematics and improve their problem-solving skills .

Bar Diagrams For Problem Solving

Physics Symbols And Names

Physics is a fascinating field of study that deals with the fundamental principles of the universe. It is a science that uses mathematical models to explain the behavior of matter and energy. Symbols are an essential part of physics, as they help us to represent physical quantities and make calculations more convenient. Here are some of the most commonly used physics symbols and their names:

– a: Acceleration
– A: Area
– B: Magnetic field
– C: Capacitance
– c: Speed of light
– d: Distance
– E: Electric field
– F: Force
– f: Frequency
– G: Gravitational constant
– h: Planck’s constant
– I: Current
– k: Boltzmann constant
– L: Inductance
– m: Mass
– n: Number density
– P: Power
– p: Momentum
– Q: Charge
– r: Radius
– R: Resistance
– T: Temperature
– t: Time
– U: Potential energy
– V: Voltage
– v: Velocity
– W: Work
– x: Displacement
– y: Height
– z: Depth

These symbols are used to represent physical quantities such as distance, time, mass, velocity, acceleration, force, energy, and power, among others. They are often combined with other symbols to represent more complex physical quantities. For example, the symbol F (force) can be combined with the symbol d (distance) to represent work, which is the product of force and distance.

It is important to note that the symbols used in physics are not arbitrary but are based on a set of conventions. For example, the symbol c is used to represent the speed of light because it is the first letter of the Latin word “celeritas,” which means speed. Similarly, the symbol h is used to represent Planck’s constant because it is the first letter of the German word “hinzpeter,” which means constant.

In conclusion, physics symbols are an essential part of the language of physics. They help us to represent physical quantities and make calculations more convenient. The symbols used in physics are not arbitrary but are based on a set of conventions.

Physics Symbols And Names