The following chart contains the most common html and css color codes for various shades of the purple color. Use these color numbers in your html and css codes. They provided as both Hex and RGB values.
Month: May 2022
Web 2.0 vs Web 3.0 explained

Web 2.0 focused on interaction and community development with network owning the data and introduction of various web applications.
Web 3.0 on the other hand focused on decentralization with higher proportion of AI amd smart applications.
This web 2.0 vs web 3.0 diagram explains the difference.
Europe population projection 2100
Europe future population projections until 2100. European population has already entered a period of decline potentially acclerated by Covid pandemic. The below chart offers various projections based on conservative, low, medium and high growth scenarios

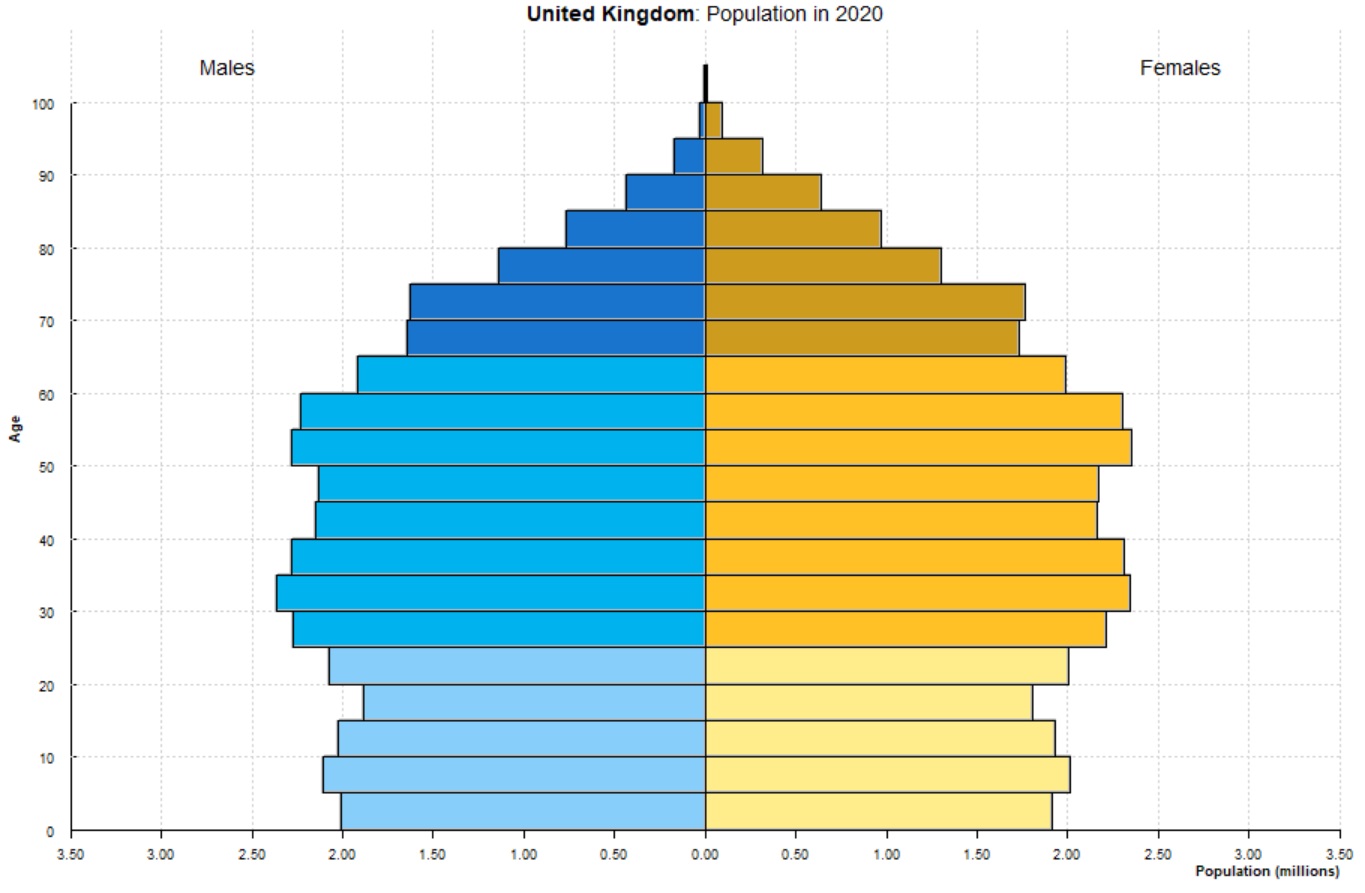
United Kingdom population pyramid
United Kingdom population pyramid is displaying a split between various age groups and male vs. female. The pyramid shows two highest age bracket in UK – one for 30-35 and the other for 50-55. Females as expected live longer than males.
Europe population pyramid
European population pyramid showing a split between various age groups and male vs. female. The pyramid shows that the highest age bracket in Europe is for those 35-40 years old for male and 55 years for females. Females as expected live longer than males.

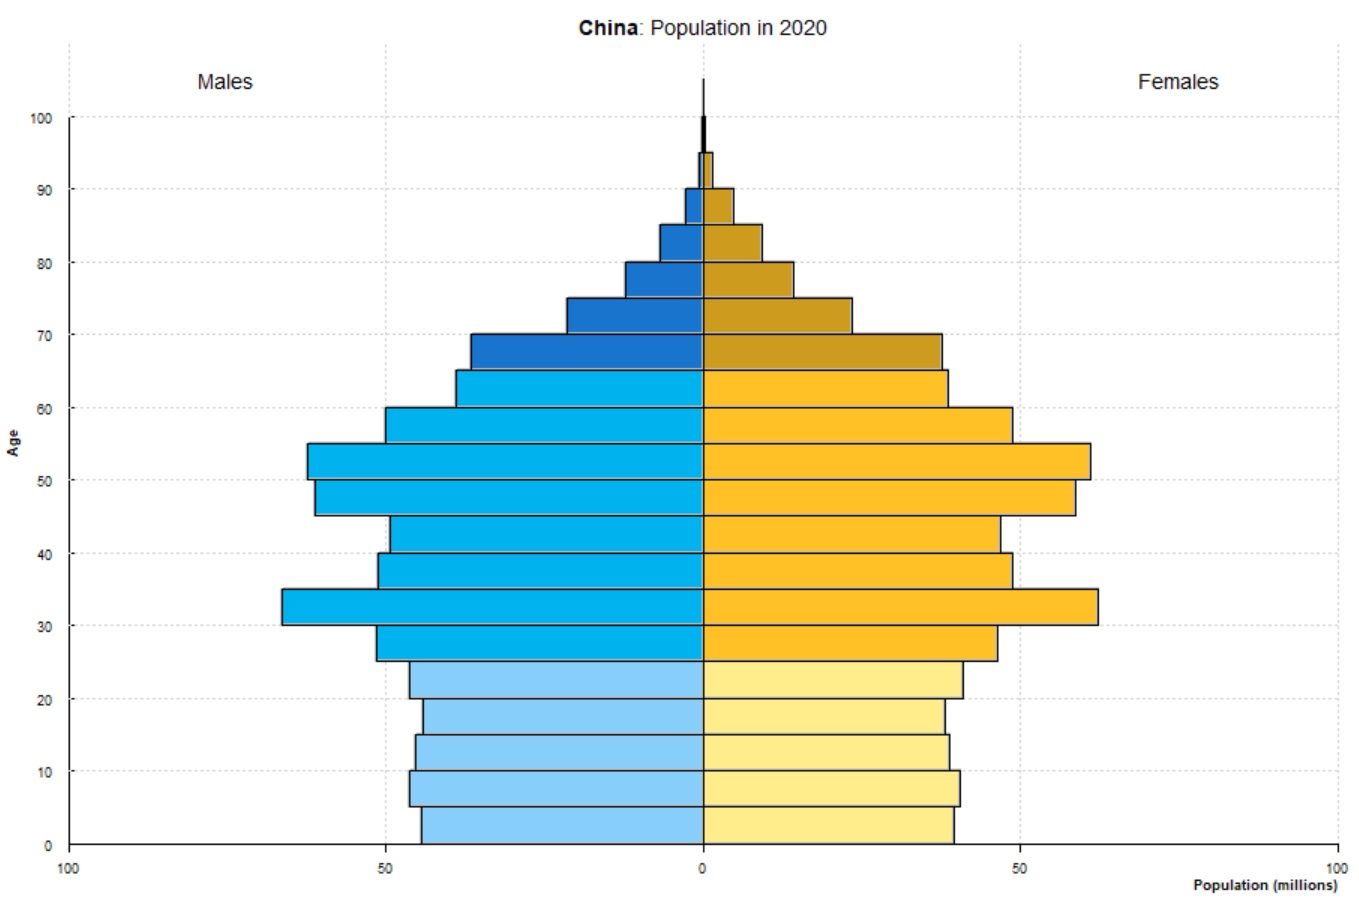
China population pyramid
Chinese population pyramid showing a split between various age groups and male vs. female. The pyramid shows that the highest age bracket is for those around 30 years old in China. Females as expected live longer than males. The shape of the pyramid is in many respects a result of the one child policy in China. Source: World population demographics
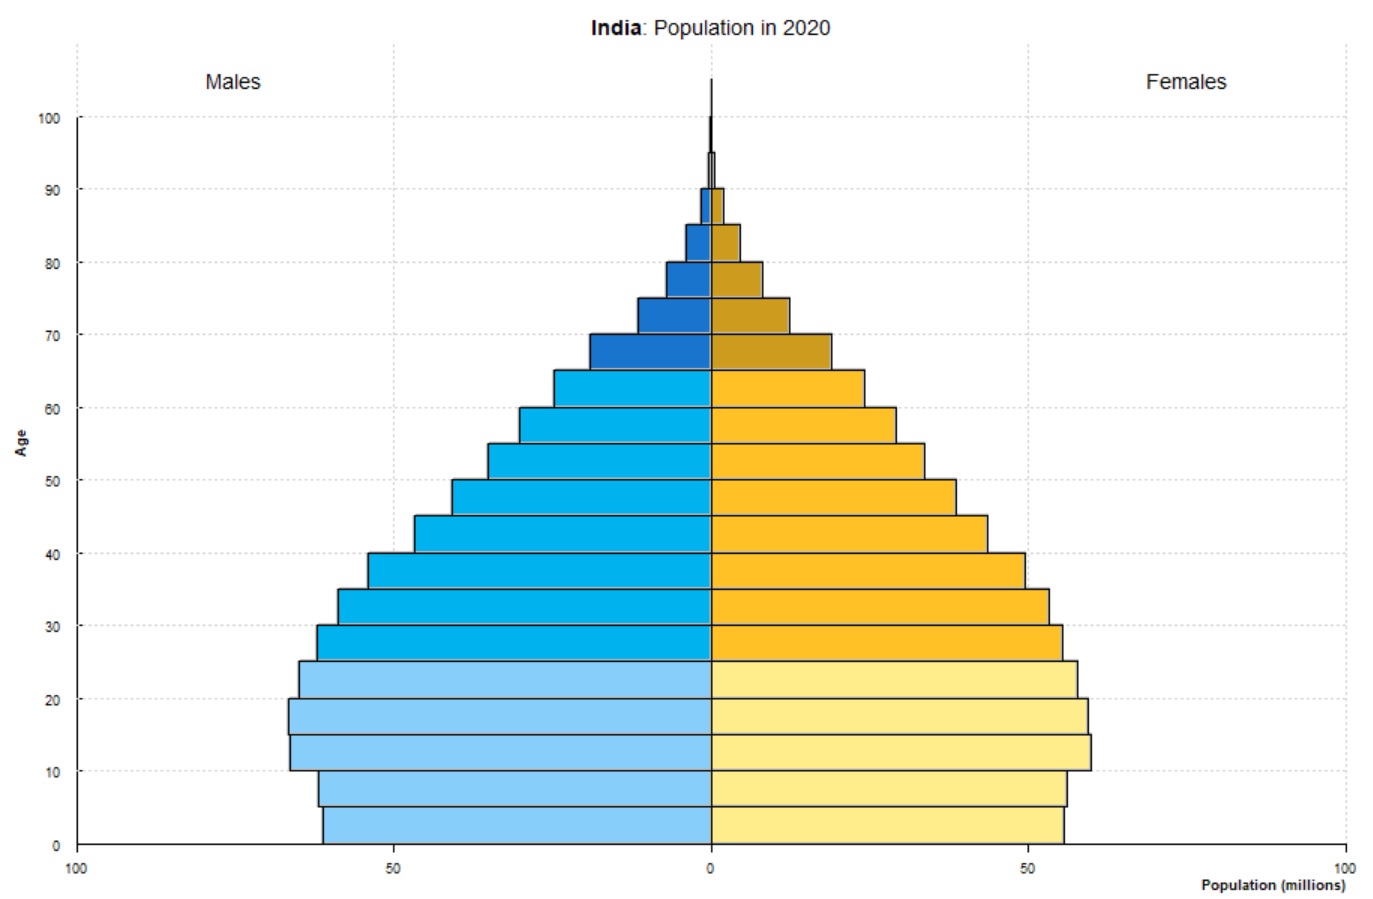
India population pyramid
India population pyramid showing a split between various age groups and male vs. female. The pyramid shows that the highest age bracket in India is for kids and teenagers between 10 and 20. Indian women are expected to live longer than men, however the difference is not as pronounced as in other countries.
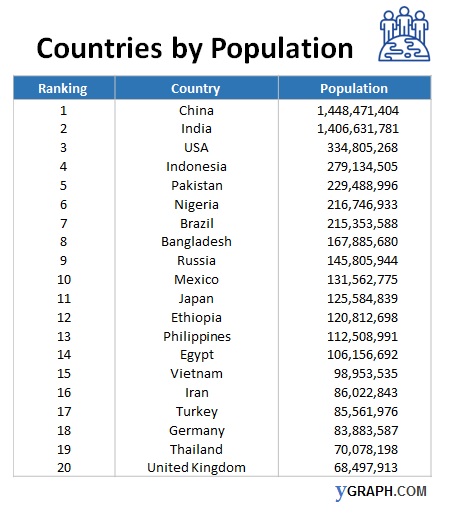
Countries by population
The following chart lists top 20 countries by the population size with China and India leading having over 1.4 billion people each.
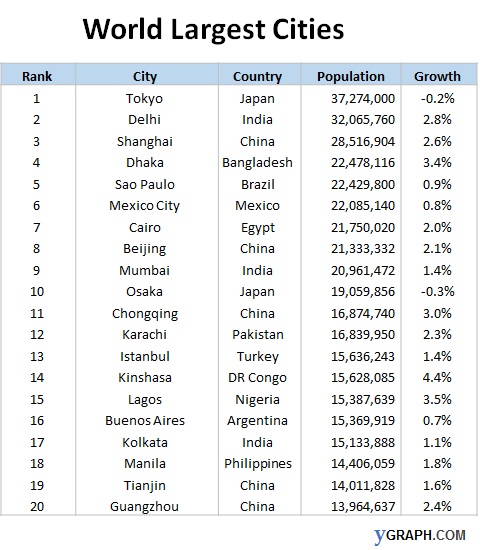
World largest cities
World’s largest cities chart showing the top 20 biggest metropolitan areas by population. The list is dominated with top cities from Asian and Latin American countries.
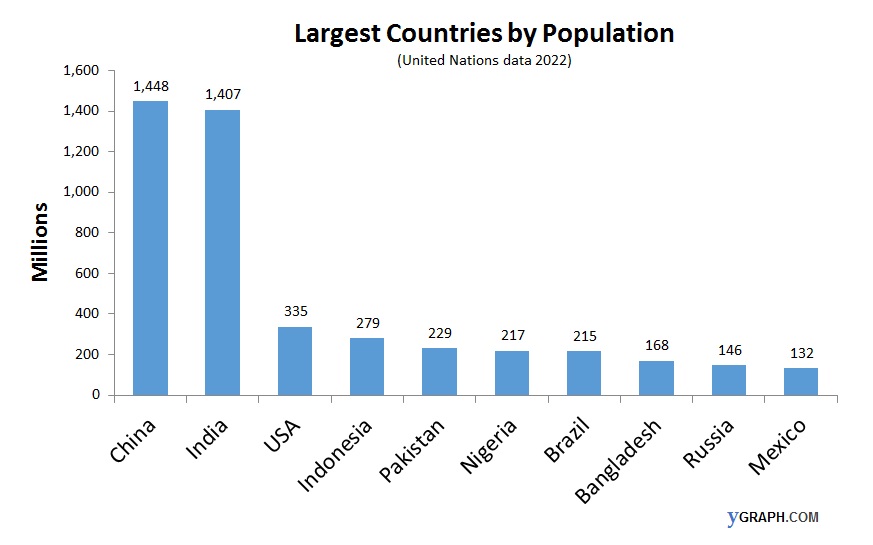
Largest countries by population
Largest countries by population graph is showing the top 10 states with the highest number of people living. The countries are China, India, United States, Indonesia, Pakistan, Nigeria, Brazil, Bangladesh, Russia and Mexico listed from highest to lowest. Source: World population growth and demographics