World’s 86 Trillion Economy

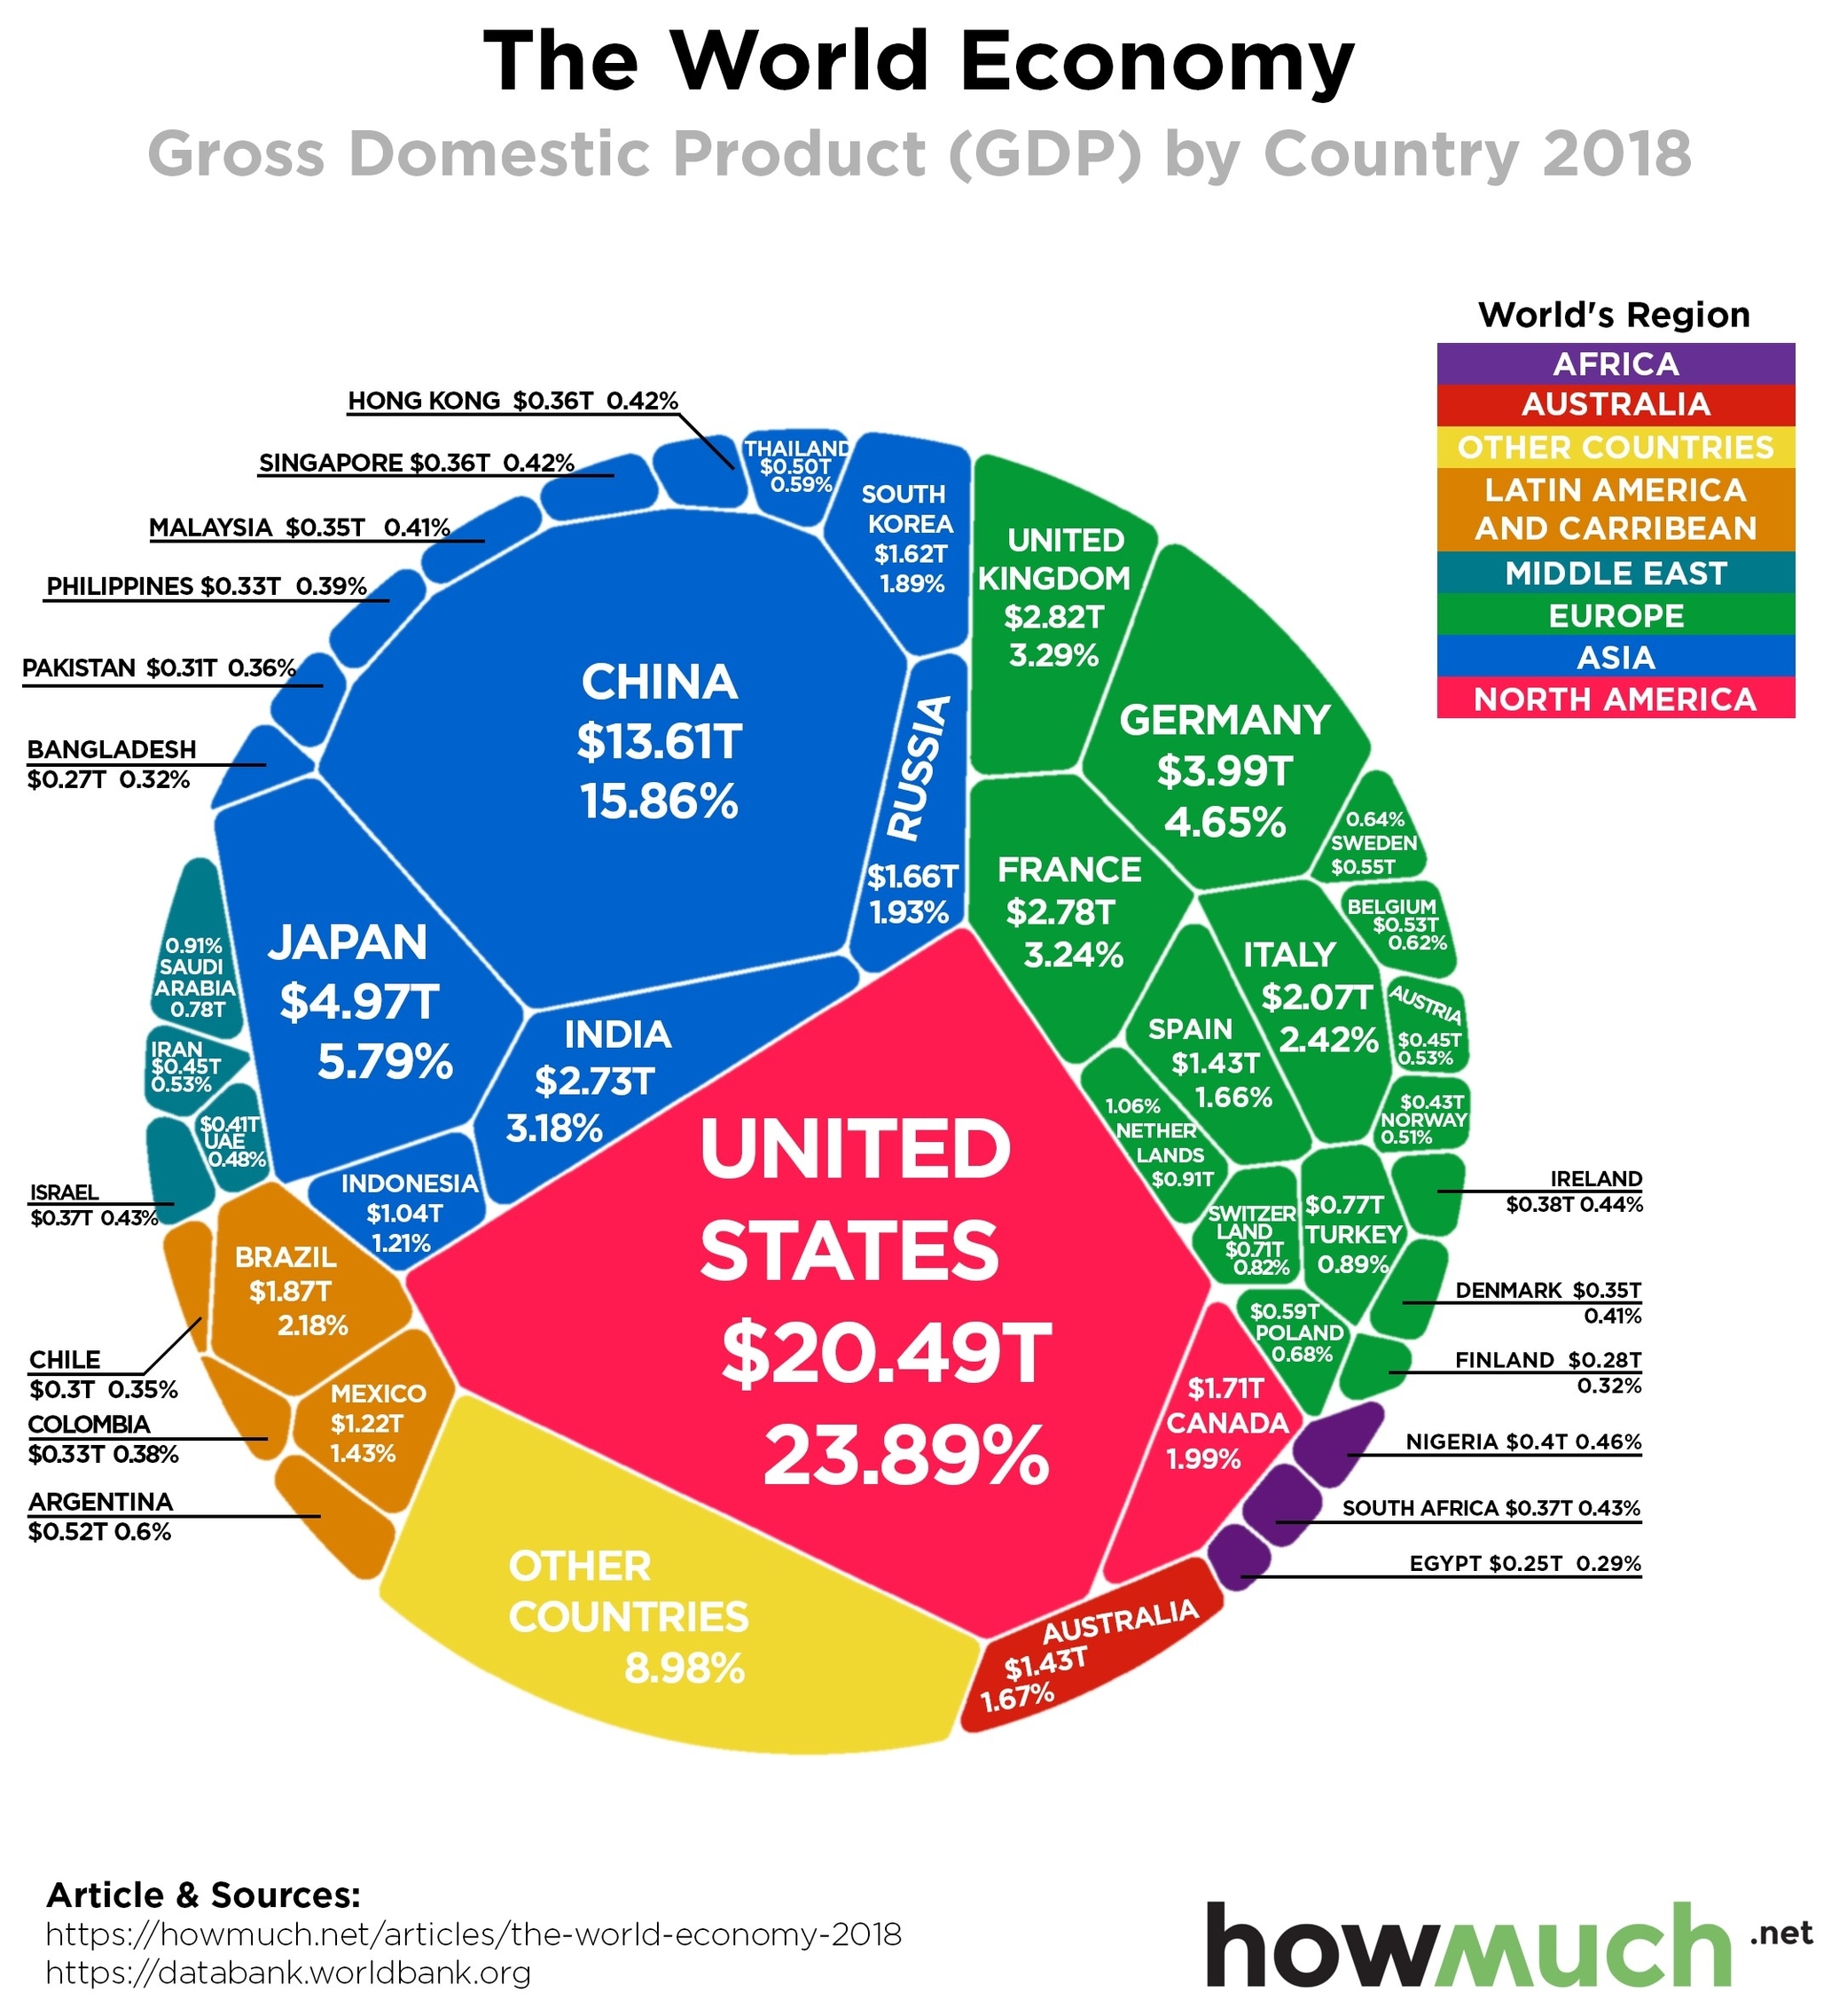
The world economy is the sum of the economic activities of all countries and regions in the world. It measures the total output of goods and services, as well as the income and wealth of the people who produce and consume them. One of the most common ways to measure the size of the world economy is by using the gross domestic product (GDP) of each country or region, and adding them up to get the global GDP.

According to the latest data from the World Bank, the global GDP in 2018 was $85.8 trillion, which means that the value of all the goods and services produced in the world in that year was equivalent to $85.8 trillion. This was an increase of 6.9% from the previous year, when the global GDP was $80.2 trillion. However, this growth rate was lower than the average of 7.5% in the past decade, indicating a slowdown in the world economy.

The world economy is not evenly distributed among the countries and regions of the world. Some countries and regions have larger and more developed economies than others, and contribute more to the global GDP. The following table shows the top 15 economies in the world by nominal GDP in 2018, as well as their share of the global GDP:

| Rank | Country/Region | GDP (Nominal, USD) | Share of Global GDP (%) |
| 1 | United States | $20.49 trillion | 23.89 |
| 2 | China | $13.61 trillion | 15.86 |
| 3 | Japan | $4.97 trillion | 5.79 |
| 4 | Germany | $4.00 trillion | 4.66 |
| 5 | United Kingdom | $2.83 trillion | 3.29 |
| 6 | France | $2.78 trillion | 3.24 |
| 7 | India | $2.73 trillion | 3.18 |
| 8 | Italy | $2.07 trillion | 2.42 |
| 9 | Brazil | $1.87 trillion | 2.18 |
| 10 | Canada | $1.71 trillion | 1.99 |
| 11 | Russia | $1.66 trillion | 1.93 |
| 12 | South Korea | $1.62 trillion | 1.89 |
| 13 | Australia | $1.43 trillion | 1.67 |
| 14 | Spain | $1.43 trillion | 1.66 |
| 15 | Mexico | $1.22 trillion | 1.43 |

The above 15 economies accounted for 75% of the global GDP in 2018, which means that the remaining 25% was shared by the other 180 countries and regions in the world. The largest economy in the world was the United States, with a GDP of $20.49 trillion, or 23.89% of the global GDP. The second largest economy was China, with a GDP of $13.61 trillion, or 15.86% of the global GDP. The gap between the two economies was narrowing, as China’s GDP grew faster than the United States’ GDP in 2018.

The world economy can also be divided into different regions, based on the geographic location and the economic characteristics of the countries and regions within them. The following table shows the GDP of the seven major regions in the world in 2018, as well as their share of the global GDP:

| Rank | Region | GDP (Nominal, USD) | Share of Global GDP (%) |
| 1 | East Asia and Pacific | $25.9 trillion | 30.2 |
| 2 | Europe and Central Asia | $23.0 trillion | 26.8 |
| 3 | North America | $22.2 trillion | 25.9 |
| 4 | Latin America and Caribbean | $5.8 trillion | 6.8 |
| 5 | Middle East and North Africa | $3.6 trillion | 4.2 |
| 6 | South Asia | $3.5 trillion | 4.1 |
| 7 | Sub-Saharan Africa | $1.7 trillion | 2.0 |

The largest region in the world by GDP was East Asia and Pacific, with a GDP of $25.9 trillion, or 30.2% of the global GDP. This region included China, Japan, South Korea, Australia, and other countries and territories in Asia and Oceania. The second largest region was Europe and Central Asia, with a GDP of $23.0 trillion, or 26.8% of the global GDP. This region included Germany, France, United Kingdom, Italy, Russia, and other countries and territories in Europe and Central Asia. The third largest region was North America, with a GDP of $22.2 trillion, or 25.9% of the global GDP. This region included the United States, Canada, and Mexico.

The world economy can also be classified into different income levels, based on the average income per person of the countries and regions in the world. The World Bank uses four income categories: high income, upper middle income, lower middle income, and low income. The following table shows the GDP of the four income groups in the world in 2018, as well as their share of the global GDP:

| Income Group | GDP (Nominal, USD) | Share of Global GDP (%) |
| High income | $54.1 trillion | 63.1 |
| Upper middle income | $24.4 trillion | 28.4 |
| Lower middle income | $6.7 trillion | 7.8 |
| Low income | $0.6 trillion | 0.7 |

The largest income group in the world by GDP was the high income group, with a GDP of $54.1 trillion, or 63.1% of the global GDP. This group included the United States, Japan, Germany, France, United Kingdom, Canada, Australia, and other countries and regions with a gross national income (GNI) per capita of $12,376 or more in 2018. The smallest income group was the low income group, with a GDP of $0.6 trillion, or 0.7% of the global GDP. This group included Afghanistan, Haiti, Ethiopia, Malawi, and other countries and regions with a GNI per capita of $1,025 or less in 2018.

The world economy is constantly changing and evolving, as a result of various factors, such as population growth, technological innovation, trade and investment, political and social events, and environmental issues. Some of the current trends and challenges that affect the world economy are:

– The impact of the COVID-19 pandemic, which has caused a global health crisis and an unprecedented economic shock, disrupting production, consumption, trade, and travel, and threatening millions of lives and livelihoods.
– The rise of China and other emerging economies, which have increased their economic power and influence, and challenged the dominance of the United States and other advanced economies, creating new opportunities and tensions in the global economic order.
– The shift to a digital and knowledge-based economy, which has transformed the nature and structure of economic activities, and created new sources of growth and innovation, as well as new risks and inequalities.
– The need for a green and sustainable economy, which can address the urgent problems of climate change, environmental degradation, and resource depletion, and ensure the well-being of the present and future generations.

The world economy is a complex and dynamic system, that reflects the interactions and interdependencies of billions of people and millions of organizations across the globe. It is a source of wealth and welfare, as well as of conflict and crisis. It is a subject of study and analysis, as well as of policy and action. It is the world economy.
World's 86 Trillion Economy

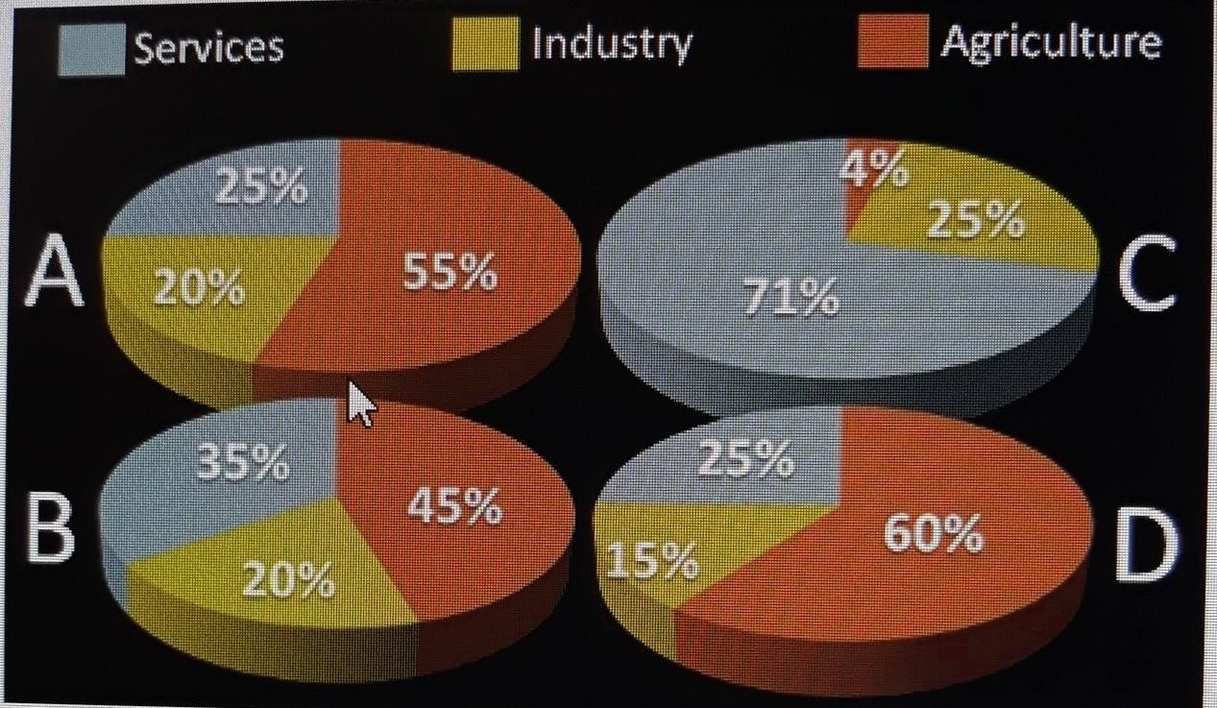
Gdp Composition By Sector

GDP composition by sector is a way of measuring the contribution of different economic sectors to the total gross domestic product (GDP) of a country or region. GDP is the monetary value of all the final goods and services produced within a given period of time. Economic sectors are broad categories of economic activities that share common characteristics, such as agriculture, industry, and services.

The most common way of dividing the economy into sectors is based on the three-sector theory, which distinguishes between primary, secondary, and tertiary sectors. The primary sector includes activities that directly extract or harvest natural resources, such as agriculture, forestry, fishing, and mining. The secondary sector includes activities that transform raw materials into finished or semi-finished products, such as manufacturing, construction, and utilities. The tertiary sector includes activities that provide services to consumers or other businesses, such as trade, transport, communication, education, health, finance, and government.

The GDP composition by sector can vary significantly across countries and regions, depending on their level of development, natural endowments, economic policies, and historical factors. Generally, less developed countries tend to have a larger share of GDP from the primary sector, while more developed countries tend to have a larger share of GDP from the tertiary sector. The secondary sector usually peaks at an intermediate stage of development, as countries undergo industrialization and urbanization. However, there are also exceptions and variations to this pattern, as some countries may specialize in certain sectors due to comparative advantages or strategic choices.

The GDP composition by sector can also change over time, as countries experience structural transformation, which is the process of shifting the allocation of resources and output from one sector to another. Structural transformation is often driven by changes in technology, productivity, demand, trade, and institutions, which affect the relative profitability and competitiveness of different sectors. Structural transformation can have significant implications for economic growth, employment, income distribution, and environmental sustainability.

The following table shows the GDP composition by sector for some selected countries and regions, based on the nominal GDP data from the World Bank for the year 2023. The table also shows the real GDP data from the International Monetary Fund for the year 2017, which are adjusted for price differences and inflation. The table illustrates the diversity and dynamics of the GDP composition by sector across the world.

| Country/Region | Nominal GDP (USD$) | Primary (%) | Secondary (%) | Tertiary (%) | Real GDP (US$MM) | Primary (%) | Secondary (%) | Tertiary (%) |
| World          | 104,480            | 5.9         | 30.5          | 63.6        | 127,800,000      | 6.4         | 30.0          | 63.6        |
| China          | 17,700             | 6.9         | 40.1          | 52.9        | 23,210,000       | 7.9         | 40.5          | 51.6        |
| USA            | 26,950             | 1.12        | 19.1          | 79.7        | 19,490,000       | 0.9         | 19.1          | 80.0        |
| India          | 3,730              | 17.4        | 25.8          | 56.9        | 9,474,000        | 15.4        | 23.0          | 61.6        |
| Japan          | 4,230              | 1.2         | 27.5          | 71.4        | 5,443,000        | 1.2         | 27.8          | 71.0        |
| Canada         | 2,120              | 1.8         | 28.6          | 69.6        | 1,847,000        | 1.6         | 28.2          | 70.2        |

Gdp Composition By Sector

Global economy contribution by country

See the below image for the Global economy contribution by country diagram. The nominal GDP of the top 10 economies adds up to about 67% of the world’s economy, while the top 20 economies contribute almost 81%. The remaining 173 countries together constitute less than one-fifth to the world’s economy. Note: This list is based on the IMF’s World Economic Outlook Database, April 2018.

Top 10 Largest Countries by GDP (2019) Country GDP (2019) % Of Total World GDP 1. United States $21.43T 24.42% 2. China $14.34T 16.34% 3. Japan $5.08T 5.79% 4. Germany $3.85T 4.38% 6 more rows …

Global trade United States are leading in terms of GDP 20.89tr USD GDP of emerging and developing countries 34.3tr USD Share of advanced economies in global GDP 42.45% Global economic indicators

Global economy contribution by country

Circular flow of a mixed economy

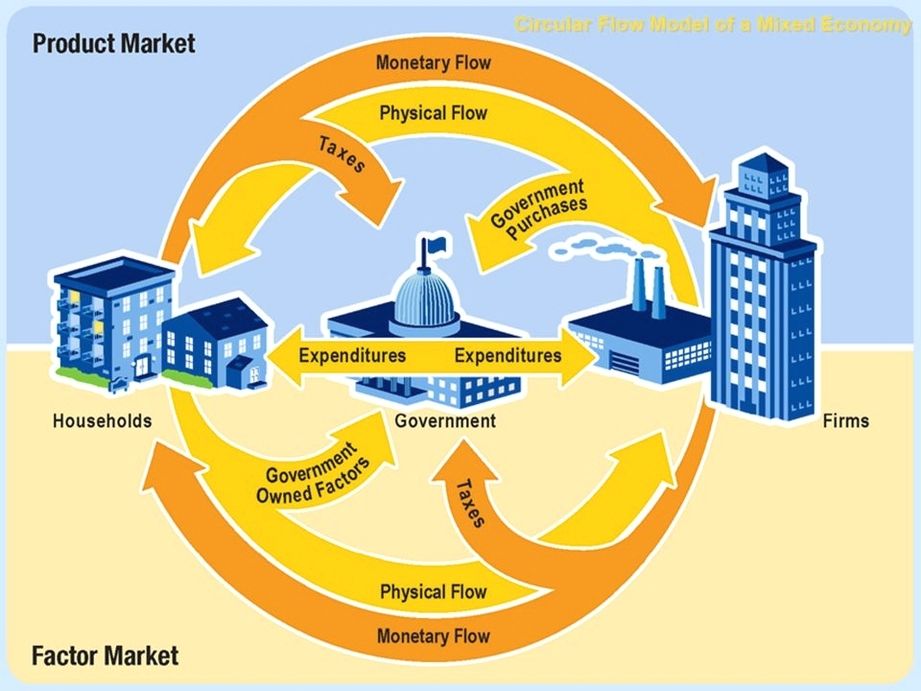
See the below image for the Circular flow of a mixed economy diagram. The circular flow model of the economy distills the idea outlined above and shows the flow of money and goods and services in a capitalist economy.

The most common form of this model shows the circular flow of income between the household sector and the business sector. Between the two are the product market and the resource market. Households purchase goods and services, which businesses provide through the product market.

When households pay for the Nutella jars, the money will reach the factory owners, completing the money’s circular flow. It is important to note that the economy runs on several thriving circular money movements. The above example is simplistic.

Circular flow of a mixed economy

Sustainable economy

See the below image for the Sustainable economy diagram. The Thwing Center defines economic sustainability in its traditional sense as: […] The ability of an economy to support a defined level of economic production indefinitely.” – Thwing Center, Economic Sustainability

The Sustainable Economy 1 Putting a Price on the Priceless. The first trend contributing to Sustainability 3.0 is the recent progress on quantifying ecosystem services— that is, measuring, in dollar terms, the value of … 2 Funding the High Road. … 3 Converging on Value Chain Indices. … 4 Data, Vision, and Will. …

Europe must transform its economies and make them sustainable. A sustainable economy is one that is resilient and provides a good quality of life for everybody. It stays within the limits of the planet and helps keep global warming within the well below 2°C threshold.

Sustainable economy

Global economy in 2019

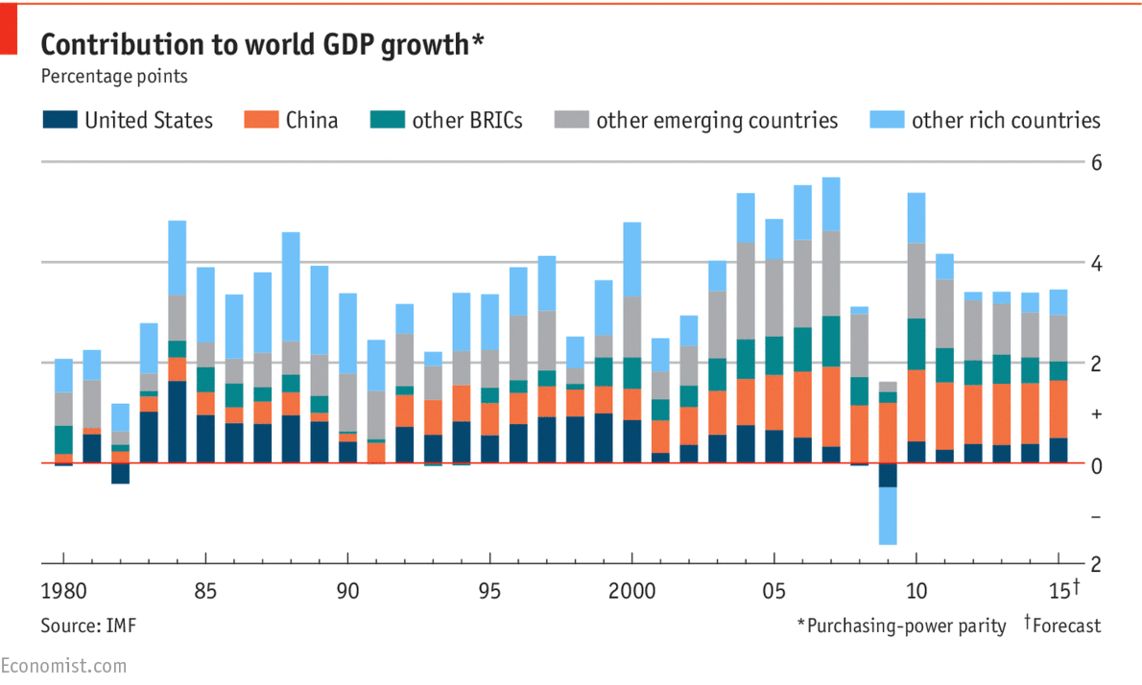
See the below image for the Global economy in 2019 diagram. The global economy started 2018 with strong, synchronized growth. But as the year progressed, momentum faded and growth trends diverged. The US economy accelerated, thanks to fiscal stimulus enacted early in the year, while the economies of the Eurozone, the UK, Japan and China began to weaken. These divergent trends will persist in 2019.

Let’s start by looking at where global growth is forecasted to occur in 2019: The data here mimics some of the previous estimates we’ve seen from Standard Chartered, such as this chart which projects the largest economies in 2030. Asia as a whole will account for 63% of all global GDP growth (PPP) this year, with the lion’s share going to China.

Global growth is expected to remain at 3.0 per cent in 2019 and 2020, however, the steady pace of expansion in the global economy masks an increase in downside risks that could potentially exacerbate development challenges in many parts of the world, according to the World Economic Situation and Prospects 2019.

Global economy in 2019

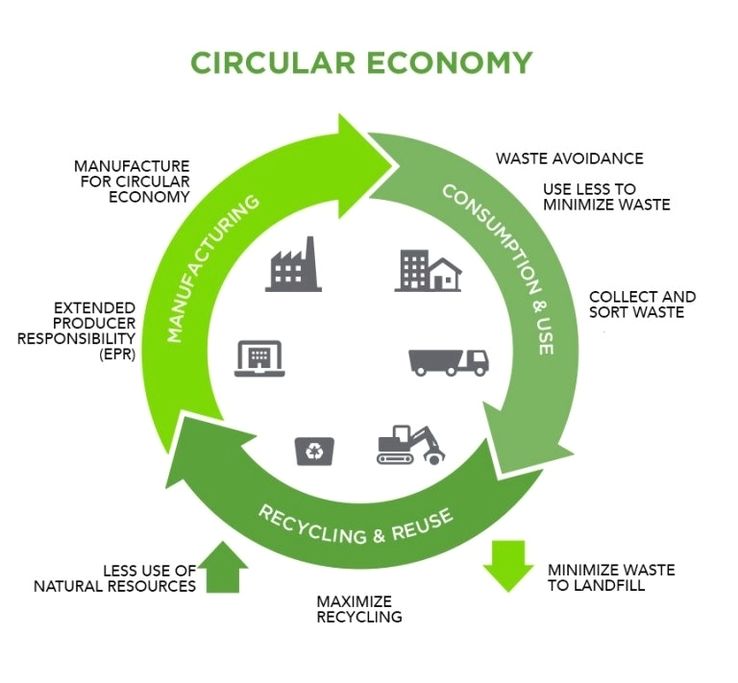
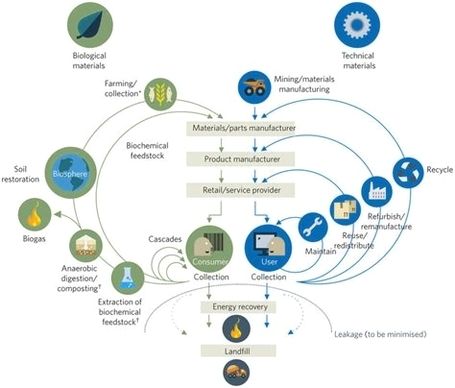
Recycling circular economy

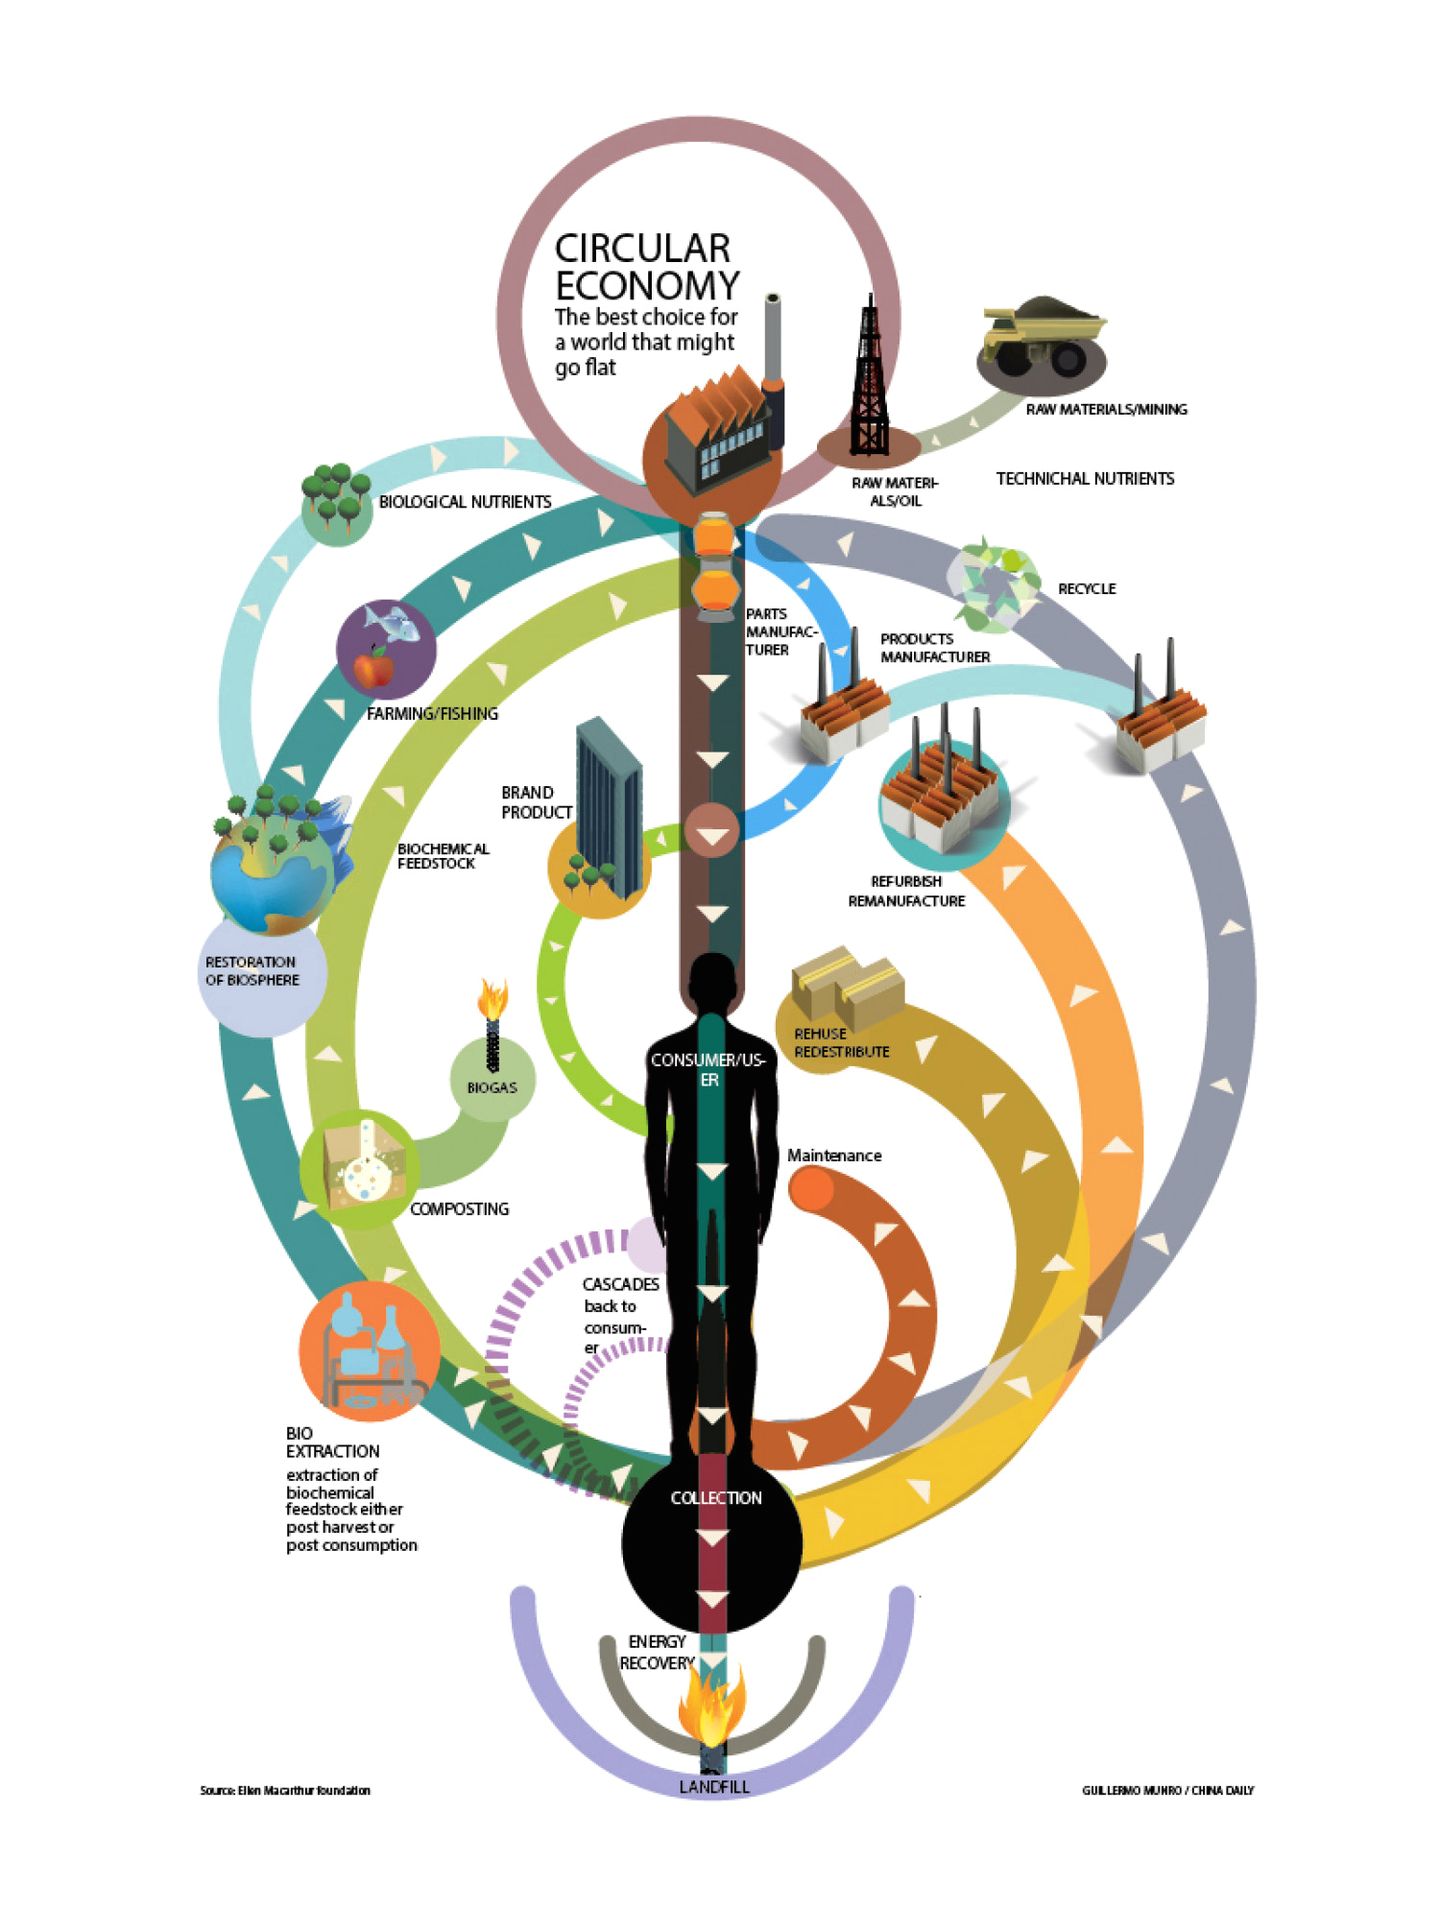
See the below image for the Recycling circular economy diagram. A circular economy aims to eliminate waste, not just from recycling processes, but throughout the lifecycles of products and packaging. A circular economy aims to maximize value and eliminate waste by improving the design of materials, products and business models. A circular economy goes beyond recycling.

Recycling requires waste – and waste is what a circular economy seeks to eliminate. Too often the concept of a circular economy is muddled up with some kind of advanced recycling process that would mean keeping our industrial system as it is and preserving a growing consumption model.

It is a change to the model in which resources are mined, made into products, and then become waste. A circular economy reduces material use, redesigns materials to be less resource intensive, and recaptures waste” as a resource to manufacture new materials and products.

Recycling circular economy

How economy works infographic

See the below image for the How economy works infographic diagram. Economy Infographics Graphical ways of displaying numerical data, principles, and specifics are widely used in economy, economic analysis, and statistics.

There are a few samples that you see on this page which were created in the ConceptDraw DIAGRAM application by using the Economy Infographics solution. Some of the solution’s capabilities as well as the professional results which you can achieve are all demonstrated here on this page.

The use of graphical methods in economics and statistics allows one to visually display economic phenomena, observation results, present statistical parameters, economic data and indicators and their quantitative changes, display the relationships between objects, structures and observed events, facilitating the generalization.

How economy works infographic

Recycling economy

See the below image for the Recycling economy diagram. Recycling begins at the end – the ‘get rid’ stage of a product’s lifecycle. The circular economy, however, goes right back to the beginning to prevent waste and pollution from being created in the first place. In the face of our current environmental challenges, recycling won’t be enough to overcome the sheer amount of waste we produce.

The 2020 REI Report reiterates that recycling and recycled products play an important role in our economy and have significant positive impacts on jobs, wages and tax collections. On a national average, there are 1.17 jobs, $65,230 wages and $9,420 tax revenues attributable, for every 1,000 (US) tons of recyclables collected and recycled.

Recycling is the action or process of converting waste into reusable material. Recycling begins at the end – the ‘get rid’ stage of a product’s lifecycle.

Recycling economy

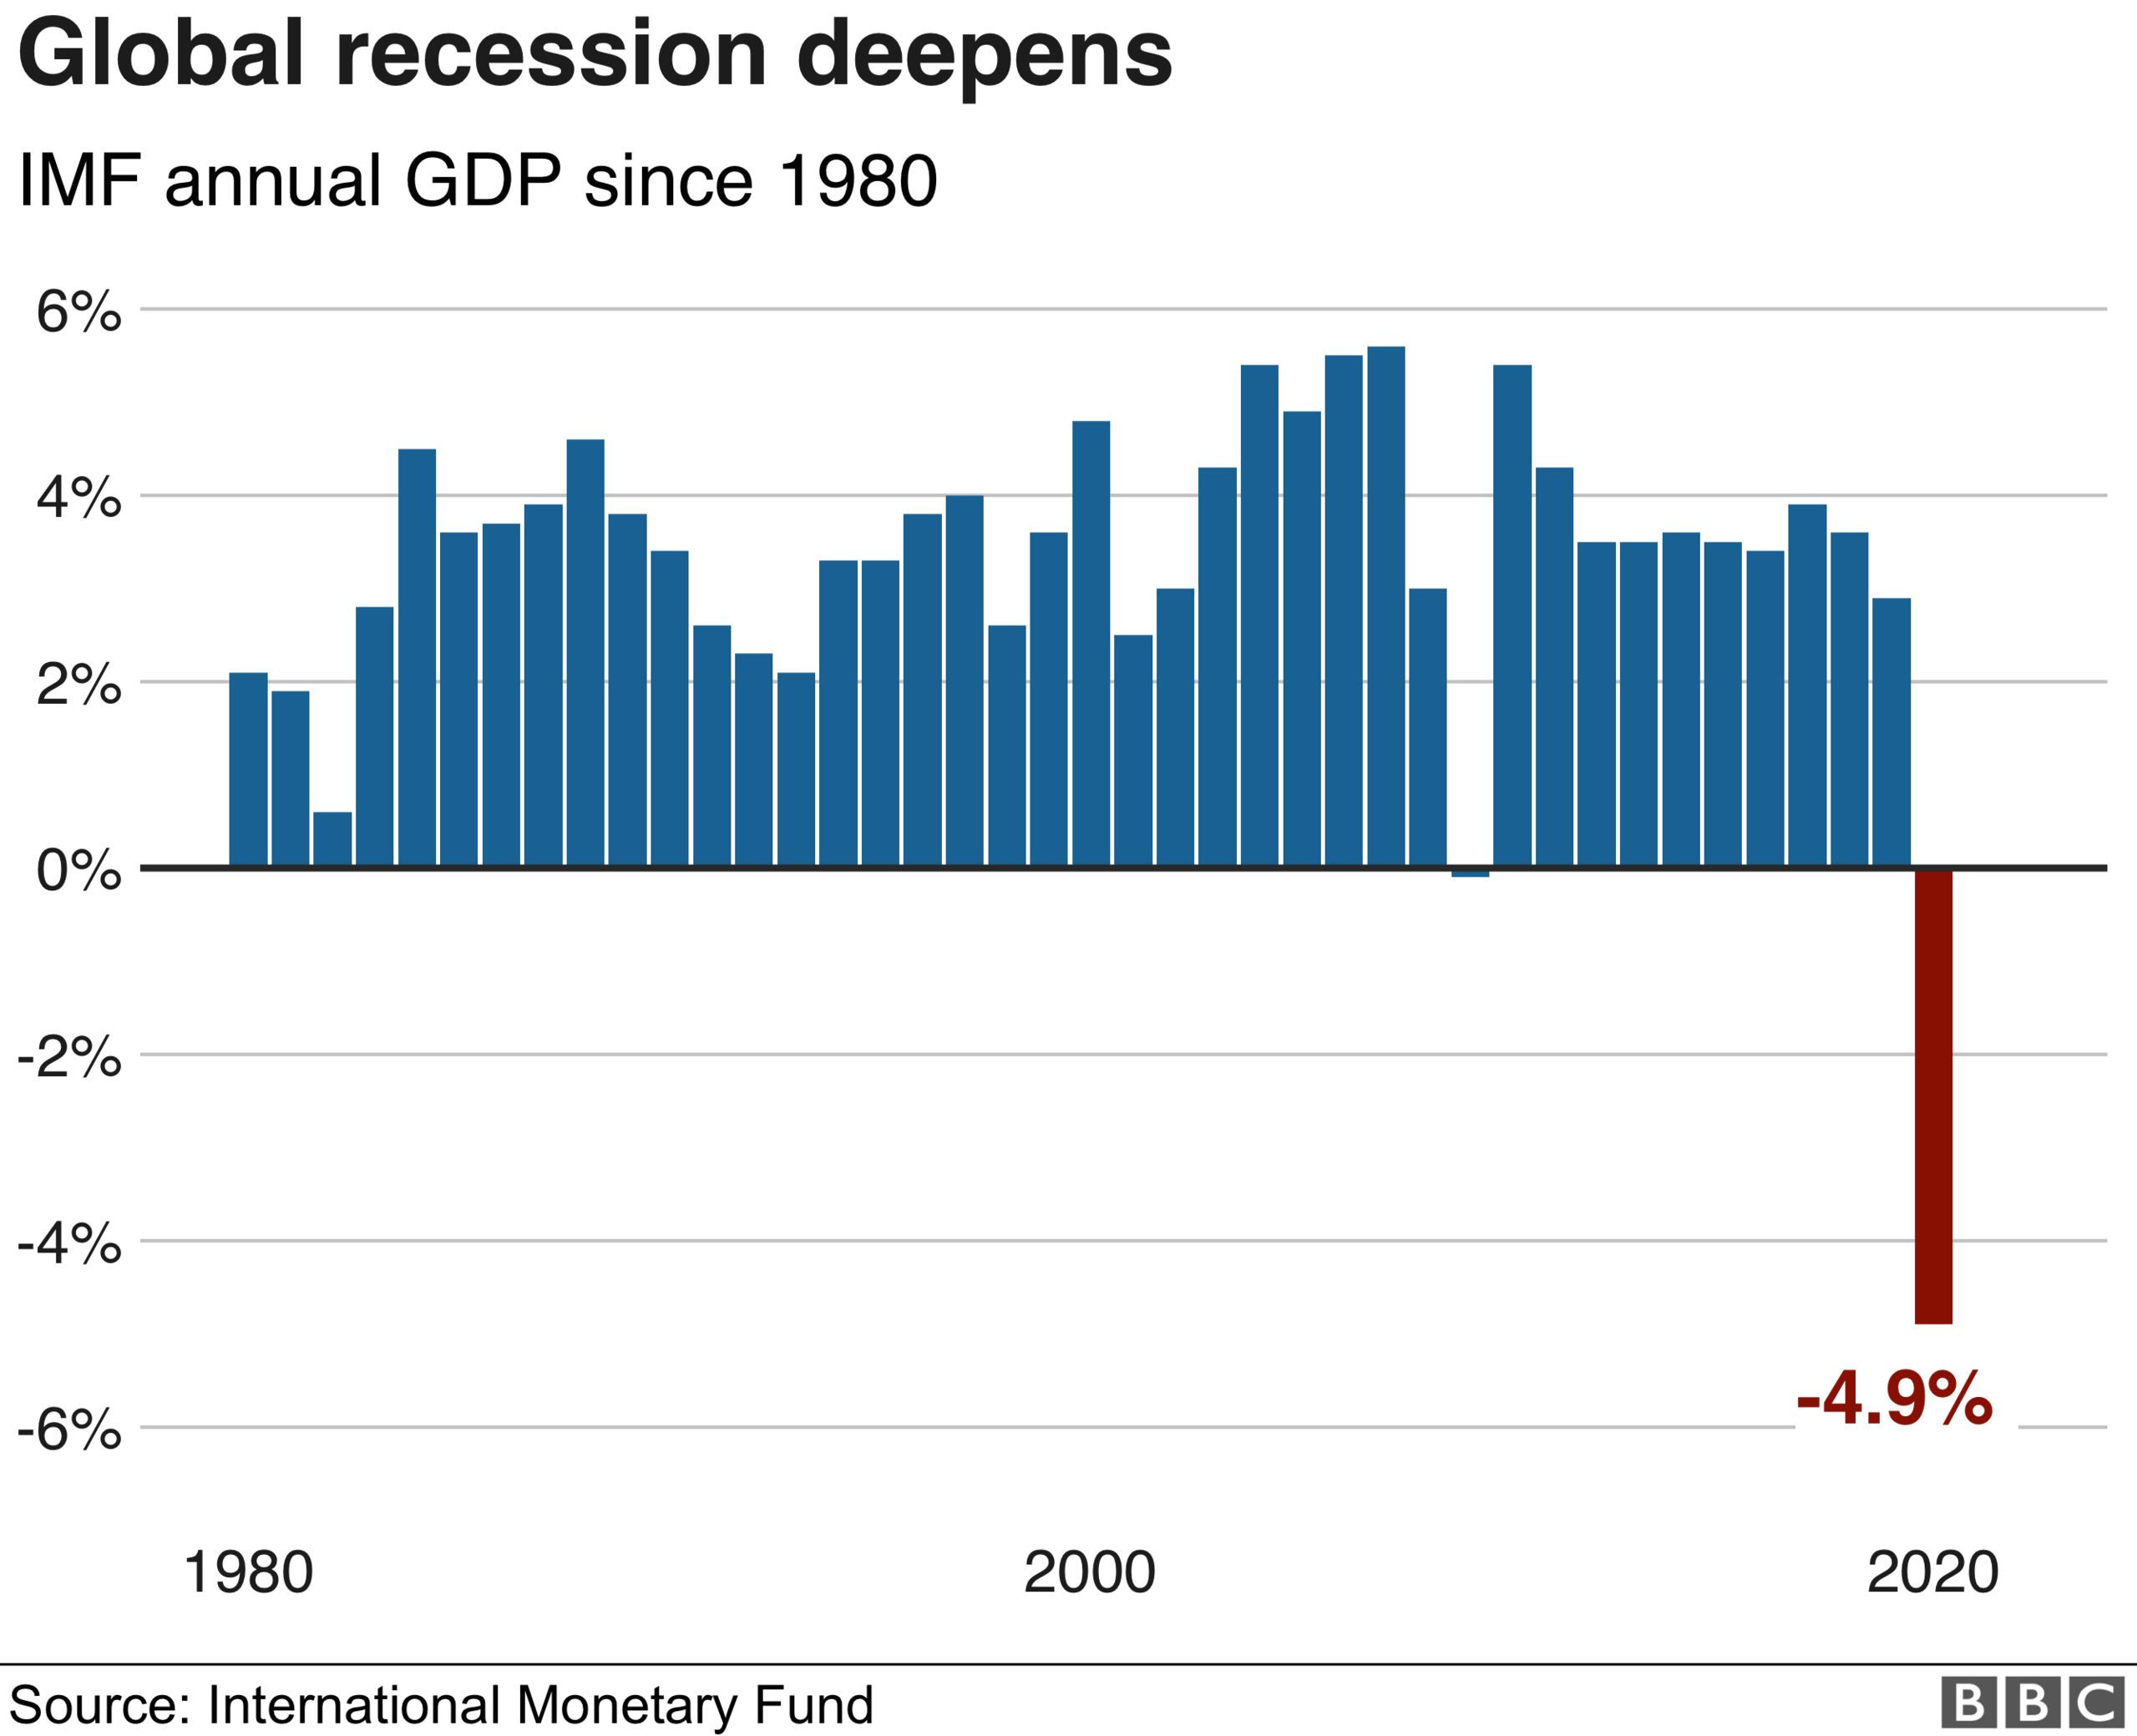
Global economy decline

See the below image for the Global economy decline diagram. Global growth is projected to decelerate in 2022 and 2023 Comparing growth contributions of major economies. Global growth is set to slow sharply, as the initial rebound in consumption and investment fades and macroeconomic support is withdrawn.

According to World Bank forecasts, the global economy will shrink by 5.2% this year. 1 That would represent the deepest recession since the Second World War, with the largest fraction of economies experiencing declines in per capita output since 1870, the World Bank says in its June 2020 Global Economic Prospects.

The IMF estimates that the global economy shrunk by 4.4% in 2020. The organisation described the decline as the worst since the Great Depression of the 1930s. The only major economy to grow in 2020 was China.

Global economy decline